RUSSELL Futures ($RTY_F) Buying The Dips At The Blue Box Area
March 21, 2024 By EWF Vlada
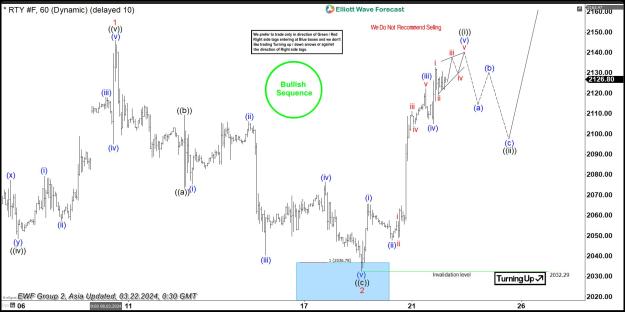
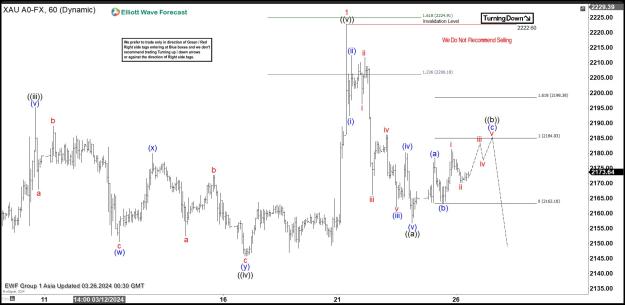
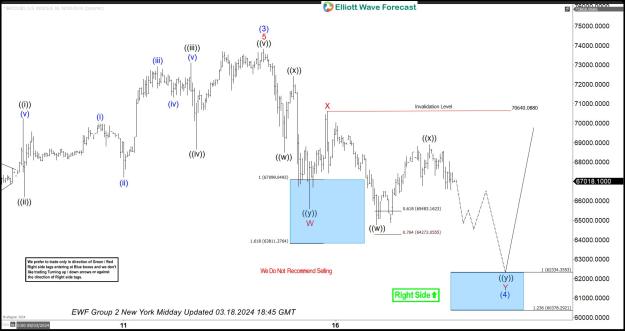
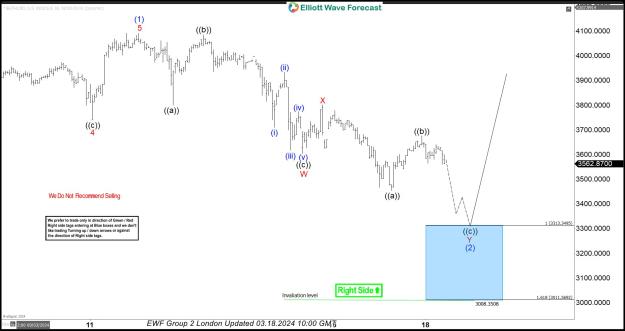
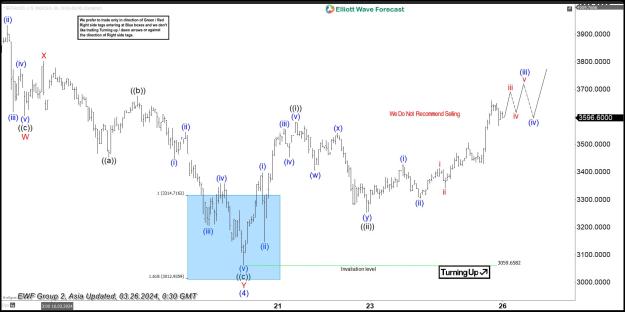
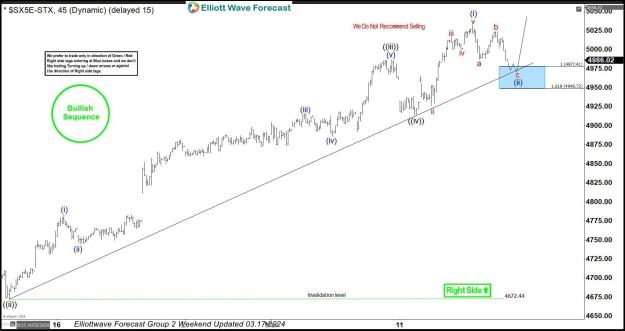
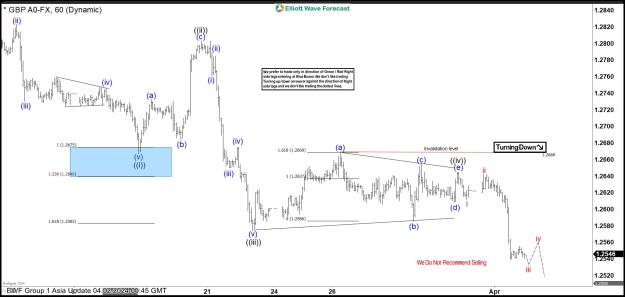
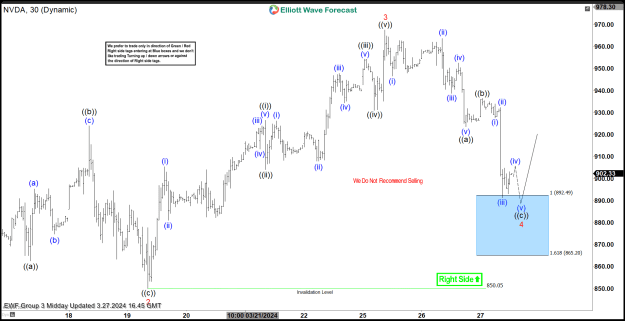
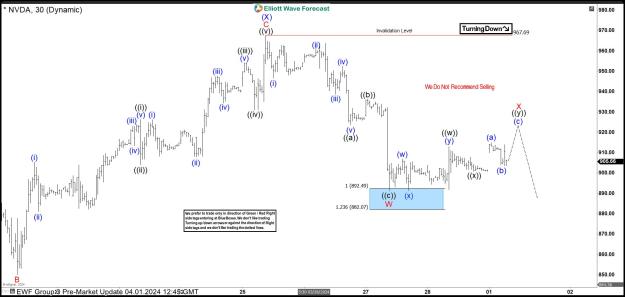
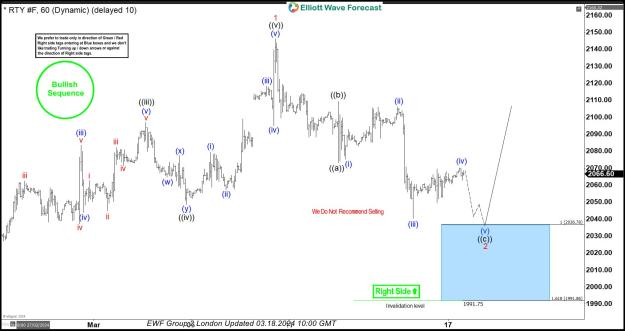
Hello fellow traders. In this technical article we’re going to take a look at the Elliott Wave charts charts of RUSSELL Futures $RTY_F published in members area of the website. As our members know we are favoring the long side in Indices. $RTY is another instrument that has given us good trading setup recently. RUSSELL made clear 3 waves down from the March 8th peak peak and completed correction right at the Equal Legs zone ( Blue Box Area) . In further text we’re going to explain the Elliott Wave pattern and trading setup.
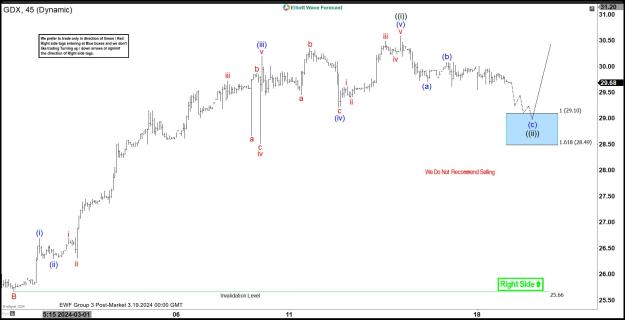
RUSSELL Elliott Wave 1 Hour Chart 03.18.2024
RUSSELL is showing lower low sequences from the peak, suggesting short term pull back is still in progress. Correction has ((a))((b))((c)) labeling. The price structure is incomplete at the moment, calling for another leg down toward : 2036.78-1991.86. We don’t recommend selling RTY_F and prefer the long side from the marked Blue Box ( buying zone). Once RUSSELL reaches our buying area, it should ideally make either rally toward new highs or in 3 waves bounce alternatively. Once bounce reaches 50 Fibs against the ((b)) black high, we will make long position risk free ( put SL at BE) and take partial profits.
Official trading strategy on How to trade 3, 7, or 11 swing and equal leg is explained in details in Educational Video, available for members viewing inside the membership area.
Quick reminder on how to trade our charts :
Red bearish stamp+ blue box = Selling Setup
Green bullish stamp+ blue box = Buying Setup
Charts with Black stamps are not tradable.
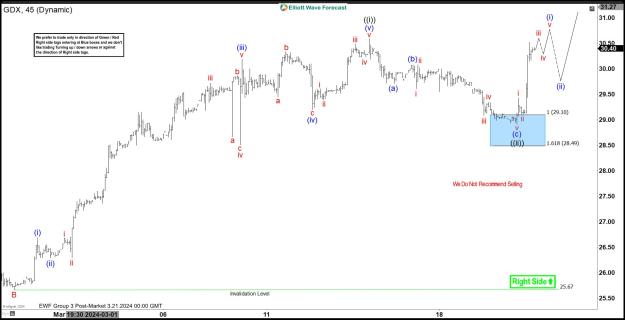
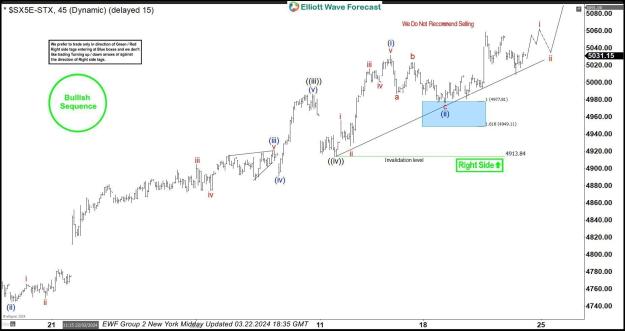
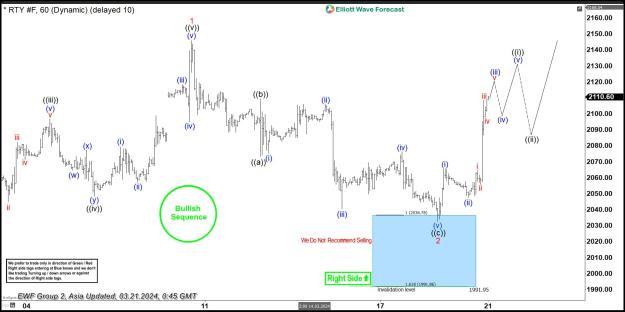
RUSSELL Elliott Wave 1 Hour Chart 02.28.2024
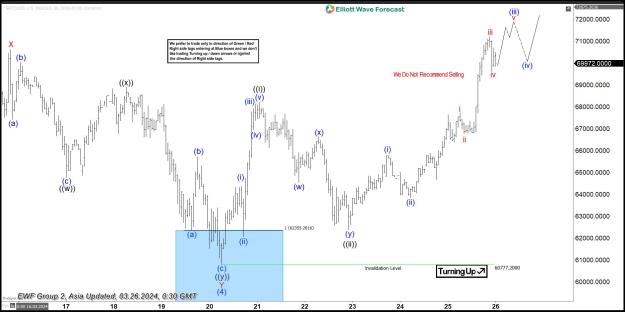
RUSSELL reached our buying zone at : 2036.78-1991.86 and found buyers as expected. RTY_F is giving us very good reaction from the Blue Box Area. We call pull back 2 red completed at the 2033.3 low. Consequently, any long positions should be risk free by now. We would like to see break of 1 red peak (March 8th) to confirm next leg up is in progress. Once it breaks above 03.08. peak, we can look to buy intraday dips again in 3,7,11 swings against the 2033.3 low
Keep in mind that market is dynamic and presented view could have changed in the mean time. You can check most recent charts with target levels in the membership area of the site. Best instruments to trade are those having incomplete bullish or bearish swings sequences. We put them in Sequence Report and best among them are shown in the Live Trading Room
New to Elliott Wave ? Check out our Free Elliott Wave Educational Web Page and download our Free Elliott Wave Book.
Elliott Wave Forecast
 Elevate your trading with Elliott Wave Forecast!
 Explore our expert insights and real-time analysis covering Forex, Indices, Commodities, Cryptocurrencies, Stocks, and ETFs across 78 instruments.
 Gain exclusive access to our Official Trading Recommendations in the Live Trading Room, where seasoned experts provide valuable insights and guidance on new trading opportunities.
 For just $9.99, unlock a wealth of knowledge and experience with our 14-day Trial. Experience firsthand our proven trading strategy, which accurately defines Entry, Stop Loss, and Take Profit levels, empowering you to make informed decisions with confidence.
 Ready to take the next step? Sign up now and seize the opportunity to enhance your trading performance. Click here to start your Trial today!
Source:https://elliottwave-forecast.com/tra...ng-equal-legs/
March 21, 2024 By EWF Vlada
Hello fellow traders. In this technical article we’re going to take a look at the Elliott Wave charts charts of RUSSELL Futures $RTY_F published in members area of the website. As our members know we are favoring the long side in Indices. $RTY is another instrument that has given us good trading setup recently. RUSSELL made clear 3 waves down from the March 8th peak peak and completed correction right at the Equal Legs zone ( Blue Box Area) . In further text we’re going to explain the Elliott Wave pattern and trading setup.
RUSSELL Elliott Wave 1 Hour Chart 03.18.2024
RUSSELL is showing lower low sequences from the peak, suggesting short term pull back is still in progress. Correction has ((a))((b))((c)) labeling. The price structure is incomplete at the moment, calling for another leg down toward : 2036.78-1991.86. We don’t recommend selling RTY_F and prefer the long side from the marked Blue Box ( buying zone). Once RUSSELL reaches our buying area, it should ideally make either rally toward new highs or in 3 waves bounce alternatively. Once bounce reaches 50 Fibs against the ((b)) black high, we will make long position risk free ( put SL at BE) and take partial profits.
Official trading strategy on How to trade 3, 7, or 11 swing and equal leg is explained in details in Educational Video, available for members viewing inside the membership area.
Quick reminder on how to trade our charts :
Red bearish stamp+ blue box = Selling Setup
Green bullish stamp+ blue box = Buying Setup
Charts with Black stamps are not tradable.
Attached Image (click to enlarge)
RUSSELL Elliott Wave 1 Hour Chart 02.28.2024
RUSSELL reached our buying zone at : 2036.78-1991.86 and found buyers as expected. RTY_F is giving us very good reaction from the Blue Box Area. We call pull back 2 red completed at the 2033.3 low. Consequently, any long positions should be risk free by now. We would like to see break of 1 red peak (March 8th) to confirm next leg up is in progress. Once it breaks above 03.08. peak, we can look to buy intraday dips again in 3,7,11 swings against the 2033.3 low
Keep in mind that market is dynamic and presented view could have changed in the mean time. You can check most recent charts with target levels in the membership area of the site. Best instruments to trade are those having incomplete bullish or bearish swings sequences. We put them in Sequence Report and best among them are shown in the Live Trading Room
New to Elliott Wave ? Check out our Free Elliott Wave Educational Web Page and download our Free Elliott Wave Book.
Attached Image (click to enlarge)
Elliott Wave Forecast
Source:https://elliottwave-forecast.com/tra...ng-equal-legs/