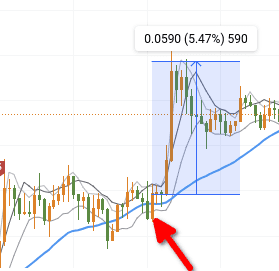
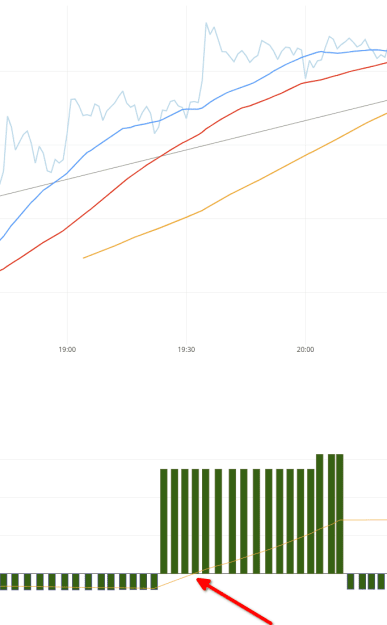
So it has been discussed many times before in this forum. But infos shared on those threads are just bits and pieces and got me nowhere. so i'm starting this thread to discuss it and to get an idea about it further. It has been discussed here that Real breakouts and fakeouts look similar in chart, but they are significantly different by the way they are formed in real time. what could be the denominator that make them different from each other? What is that that we can't "See" on charts but can be recognized in real time? Momentum or volume or something else?
- #4
- Jan 15, 2024 7:10am Jan 15, 2024 7:10am
- Joined Aug 2006 | Status: Trader | 5,320 Posts
It never gets easier, you just get better
- #7
- Jan 15, 2024 12:07pm Jan 15, 2024 12:07pm
- Joined Apr 2020 | Status: Trader/Coder | 1,929 Posts
Observer effect
- #10
- Jan 20, 2024 12:51pm Jan 20, 2024 12:51pm
- Joined Apr 2020 | Status: Trader/Coder | 1,929 Posts
Observer effect
- #13
- Jan 21, 2024 5:19am Jan 21, 2024 5:19am
- Joined Apr 2020 | Status: Trader/Coder | 1,929 Posts
Observer effect
- #14
- Jan 21, 2024 5:48am Jan 21, 2024 5:48am
- Joined Apr 2011 | Status: Hoc Etiam Transibit.... | 6,122 Posts
Simplicity is the ultimate sophistication - Leonardo da Vinci
- #16
- Jan 21, 2024 8:55am Jan 21, 2024 8:55am
- Joined Apr 2020 | Status: Trader/Coder | 1,929 Posts
Observer effect
- #19
- Jan 25, 2024 5:06am Jan 25, 2024 5:06am
- Joined Sep 2008 | Status: Verry good | 1,267 Posts
Just an opinion. Based on research 
- #20
- Jan 25, 2024 5:23am Jan 25, 2024 5:23am
- Joined Sep 2015 | Status: Trader | 2,516 Posts
Trading thin liquidity at the boundary of the charts