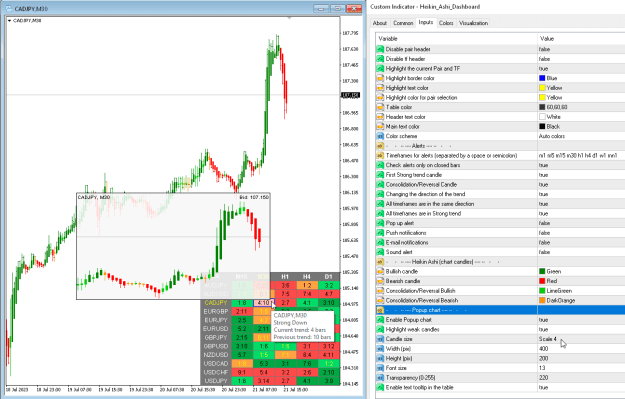
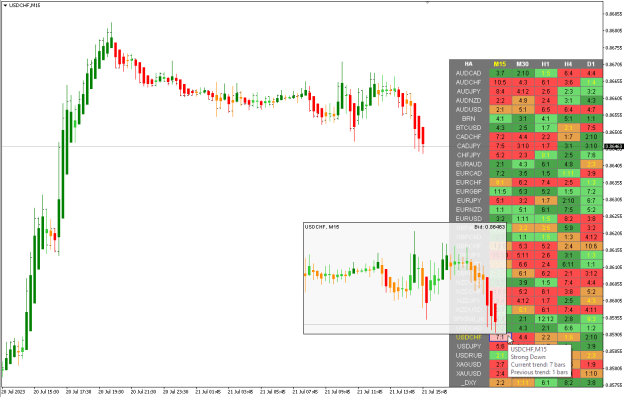
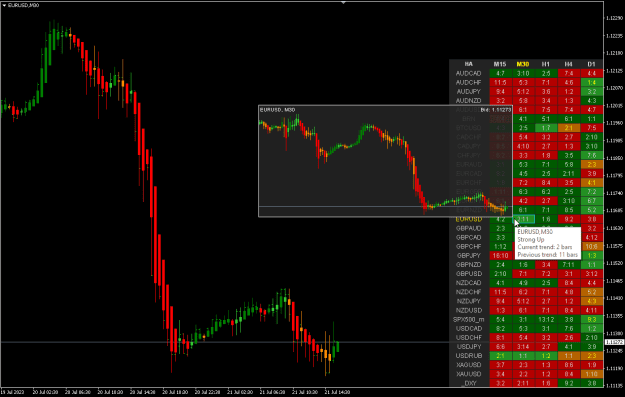
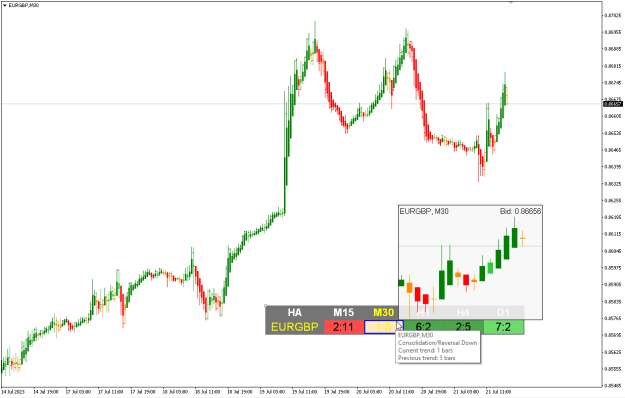
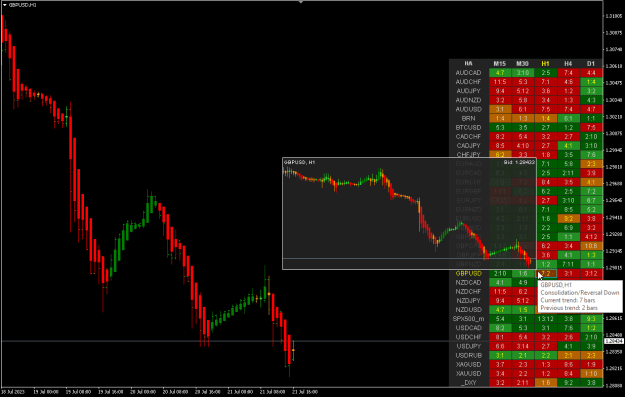
Multi-currency and multi-timeframe Heikin Ashi indicator. Shows the current state of the market. On the scanner panel you can see the direction, strength and number of bars of the current trend. The Consolidation/Reversal candles are also shown using color. You can specify any desired currencies and periods in the parameters. Also, the indicator can send notifications when the trend changes or when reversal and consolidation candles (dojis) appear. By clicking on a cell, this symbol and period will be opened. This is MTF Scanner.
Demo version you can download directly from your MT4 (MT5), from the Market tab.
And you can try it in the strategy tester, in the visual mode.
Version for MT4 & MT5.
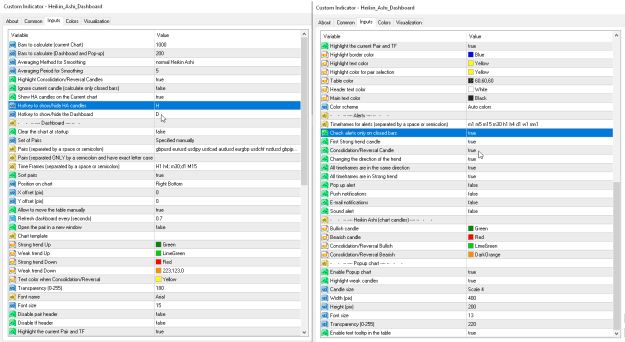
Parameters
Demo version you can download directly from your MT4 (MT5), from the Market tab.
And you can try it in the strategy tester, in the visual mode.
Version for MT4 & MT5.
Inserted Video
Attached Image (click to enlarge)
Attached Image (click to enlarge)
Attached Image (click to enlarge)
Attached Image (click to enlarge)
Attached Image (click to enlarge)
Parameters
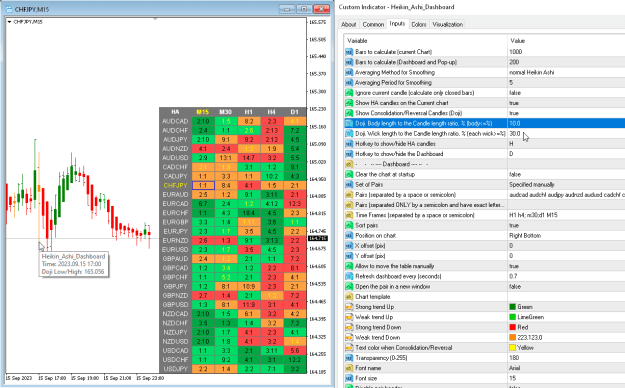
- Averaging Method for Smoothing — selection of a method for smoothing candle prices.
- Simple MA
- Exponential MA
- Smoothed MA
- Linear weighted MA
- normal Heikin Ashi
- Averaging Period for Smoothing — selection of the period for smoothing.
- Highlight Consolidation/Reversal Candles — consolidation and reversal candles will be highlighted in color on the chart and in cells.
- Ignore current candle (calculate only closed bars) — disable display of the current (not closed) candle.
- Show HA candles on the current chart — Heiken Ashi candles will be drawn on the current chart.
- Hotkey to show/hide HA candles — hotkey for hiding and showing indicator candles.
Dashboard
- Clear the chart at startup — clear the chart at startup.
- Set of Pairs — set of symbols
- Market Watch — pairs from the "Market Watch";
- Specified manually — pairs specified manually, in the parameters "Pairs".
- Current pair — show only the current pair.
- Pairs (separated by a space or semicolon) — list of symbols separated by spaces or semicolons. The currency names should be written exactly like the broker's, keeping the case and prefix/suffix.
- Time Frames (separated by a space or semicolon) — list of timeframes separated by spaces or semicolons.
- Sort pairs — sorting the list of pairs.
- Position on chart — corner to display the panel on the chart.
- X offset (pix) — shift the panel along the X axis;
- Y offset (pix) — shift the panel along the Y axis;
- Refresh dashboard every (seconds) — update period for all pairs and timeframes.
- Open the pair in a new window — open a symbol in a new chart window by clicking.
- Chart template — the name of the template for the chart, if the chart opens in a new window.
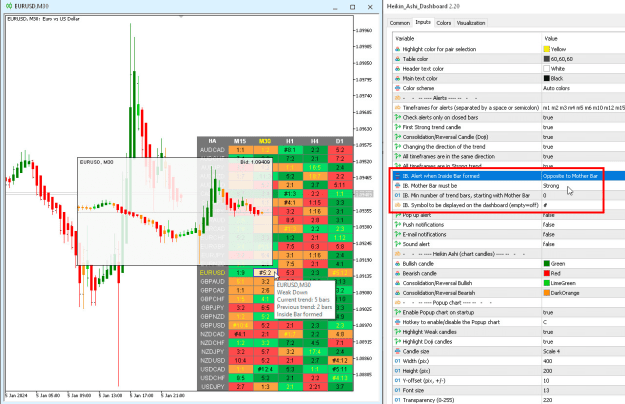
- Strong trend Up — color for a strong uptrend.
- Weak trend Up — color for a weak uptrend.
- Strong trend Down — color for a strong downtrend.
- Weak trend Down — color for a weak downtrend.
- Text color when Consolidation/Reversal — highlight color (and candles on the chart) for consolidation/reversal bars.
- Transparency (0-255).
- Font name.
- Font size.
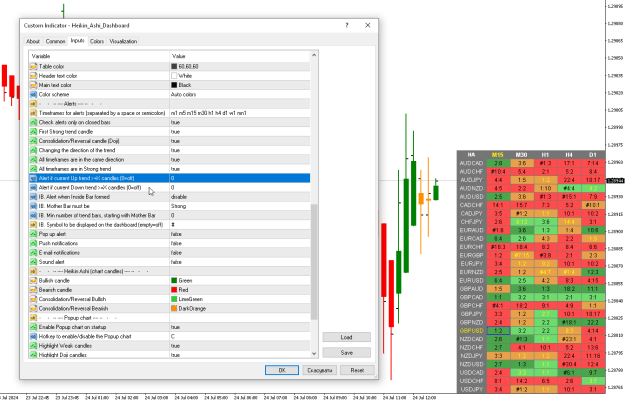
Alerts
- Timeframes for alerts (separated by a space or semicolon).
- All timeframes are in the same direction.
- Check alerts only when the candle is closed.
- First Strong trend candle — alert for the first strong trend candle.
- Consolidation/Reversal Candle — alert when a consolidation/reversal candle appears.
- Changing the direction of the trend — an alert when the direction of the trend changes.