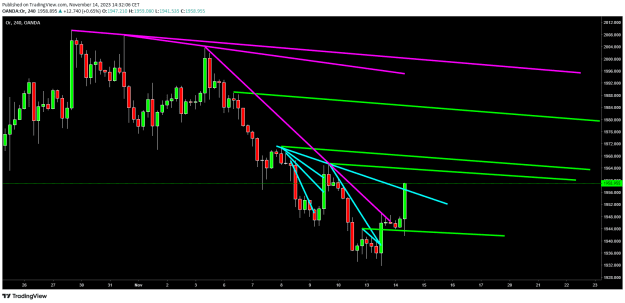
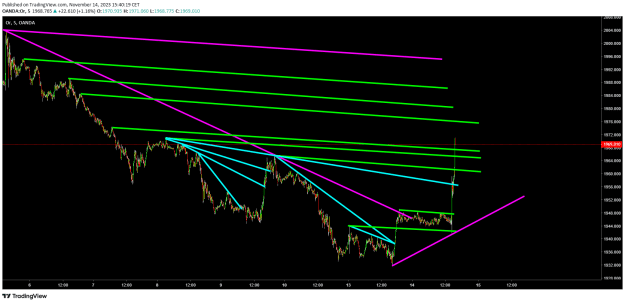
This is pretty close to what I wanted to show, try some back-tests to see if the angle of the green trend lines are truly correct in the long run. But when zoomed in it looks it fits well. Good luck!
{quote} C'est assez proche de ce que je voulais montrer, essayez quelques back-tests pour voir si l'angle des lignes de tendance vertes est vraiment correct sur le long terme. Mais quand on zoome, ça semble bien s'adapter. Bonne chance !
Ignored
Thanks for your feedback. Yes, not really easy when you trace by hand. I can never do it on my smartphone.
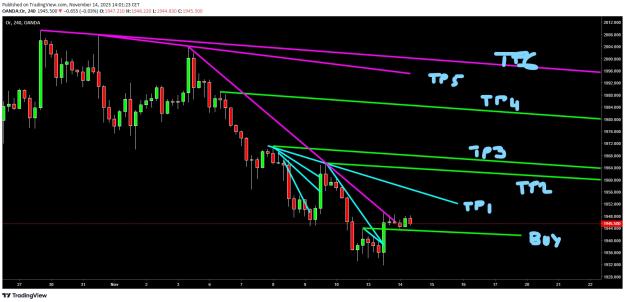
Difficult to know sometimes where to take profit (I took mine at the first TP, burned by the previous trade), just one last image to show TP 3 reached (probably luck,prices go straight). I stop after.
Attached Image (click to enlarge)
Bottomless wonders spring from simple rules, which are repeated without end
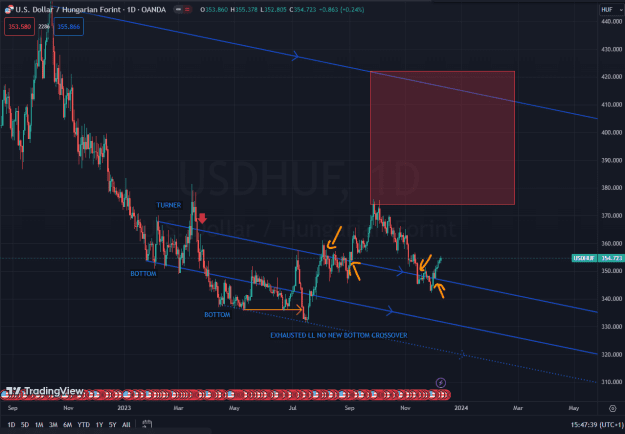
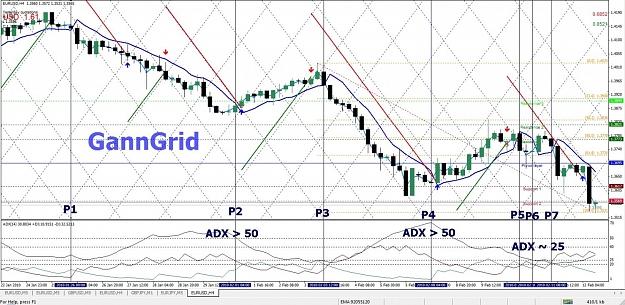
#3 - The MESH technique I have seen a similiar technique using the GANN GRID, which is not the same as what I have as that is a simmetric grid, where my mesh is somewhat flexible and always changing based on the current trend. Same chart as before and I have found a good spot to setup my DOWN trend markers {image} Here we have a nice example of an exhausted trend that eventually turned. But let's focus on building up our mesh. I have used the previous uptrend marker and the newly created downtrend marker, to try to find when my downtrend is truly...
Ignored
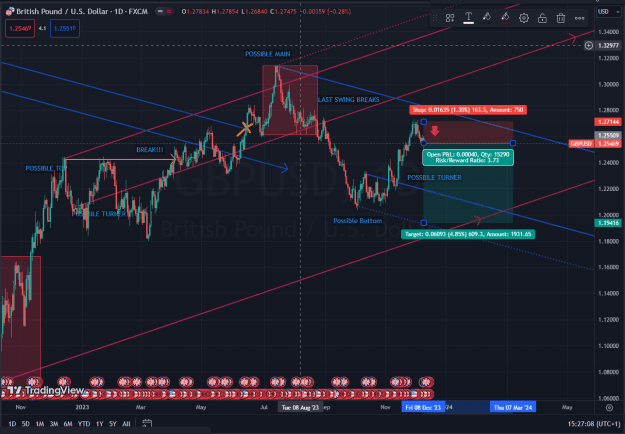
Some followup, We got our turner point, and I tend to believe that this is a good sign for a following bearish move. Reason, is that the turner marker is the next thing we needed to validate that a down trend is forming. Of course the true sign will be a break of the possible bottom marker. Let's keep an eye. For now it would be a 3.7 Ratio for a trade
Currently I am watching the USDHUF {image} This is a simple chart, I have a bit more complex one with diff timeframe stats, but sofar this sub downtrend has ended based on my tool set, and I am in since 356, and I plan to stay as long as we get to the TrendLine, To be fair, I stongly belive that my theory is correct about this price and it will eventually make a ATH, so I might take a big profit at the MAIN Marker and let the rest go just to validate my analysis. So far its pretty good, so fingers crossed!
Ignored
I had to redraw this as I lost my drawings. So... The turner line shows a great resistance now and not support. There has been two breaks from top-down on the turner and no new LLs were made. Hence I believe the prive will reach the red box on the top. Fingers Crossed!
{quote} Just some Update, It is really nice to see that huge GAP that simply just Skipped the turner line and the original bottom marker of the trend has kept the price and made it bounce back. The Good Sell Zone worked pretty well. {image} https://www.forexfactory.com/attachm...9?d=1696226058
Ignored
Another Good place to go short?
Attached Image (click to enlarge)
Since this has been drawn it worked out pretty well.
{quote} Some followup, We got our turner point, and I tend to believe that this is a good sign for a following bearish move. Reason, is that the turner marker is the next thing we needed to validate that a down trend is forming. Of course the true sign will be a break of the possible bottom marker. Let's keep an eye. For now it would be a 3.7 Ratio for a trade {image}
Ignored
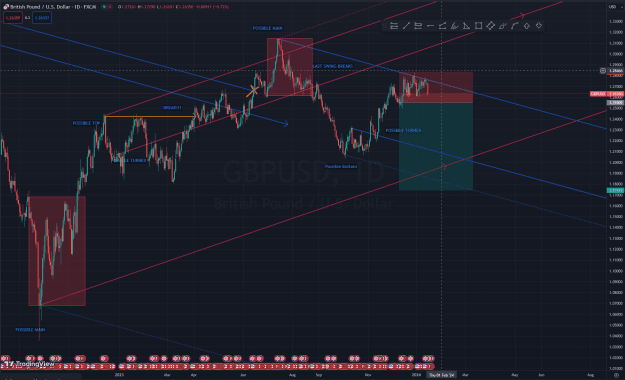
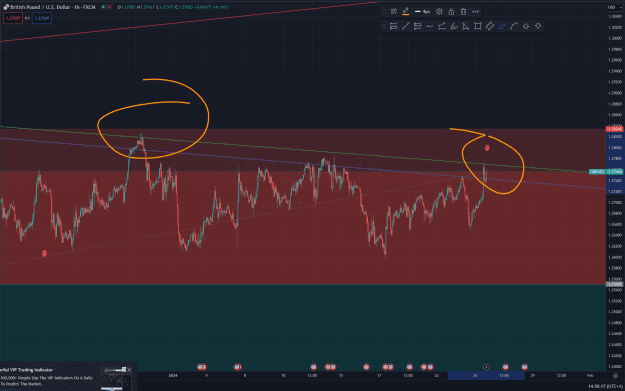
Follow up shows a nice bounce off of our trendlines. I am certain it will be bearish from now on and will make a new low. first area to reach is 1.21 towards the turner line. Next TP level is 1.2 as the new low. Ultimate goal of 1.17!
{quote} Follow up shows a nice bounce off of our trendlines. I am certain it will be bearish from now on and will make a new low. first area to reach is 1.21 towards the turner line. Next TP level is 1.2 as the new low. Ultimate goal of 1.17! {image}
Ignored
Attached Image (click to enlarge)
This seems to be the last standing of the GBPUSD, fingers crossed for the bears!
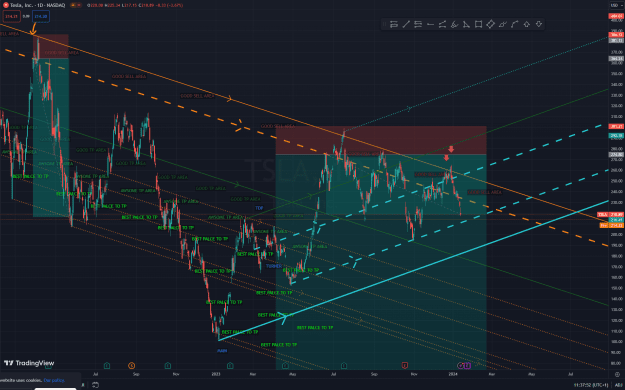
{quote} Still looking good: {image} Could be a potential buyer now!
Ignored
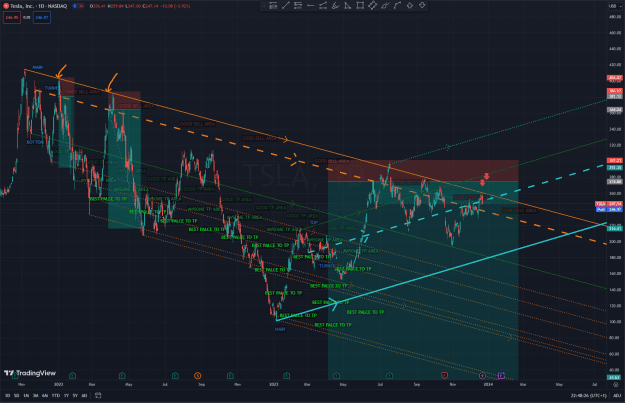
its still falling, if it continues to fall, we might be looking at the last line if defense at 185! If that falls, Tesla will loose a huge amount of money.
{quote} its still falling, if it continues to fall, we might be looking at the last line if defense at 185! If that falls, Tesla will loose a huge amount of money.
Ignored
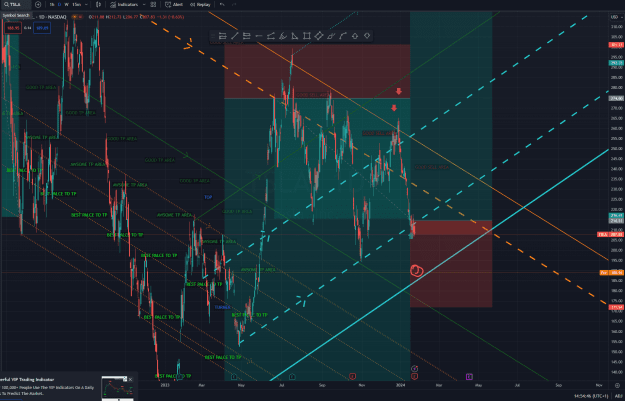
Seems Like Tesla will open at 189, let's see if it will make it to 185 and rebounce.
{quote} Seems Like Tesla will open at 189, let's see if it will make it to 185 and rebounce. {image}
Ignored
Attached Image (click to enlarge)
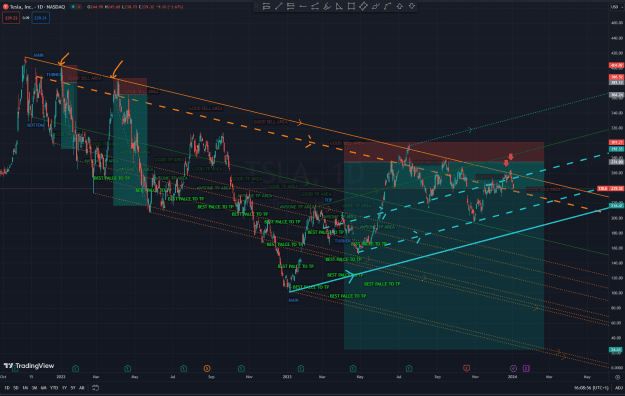
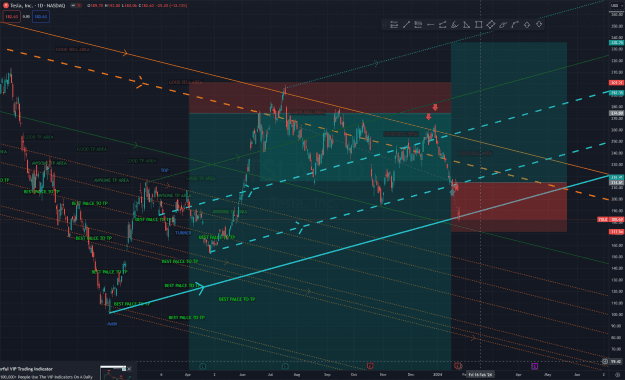
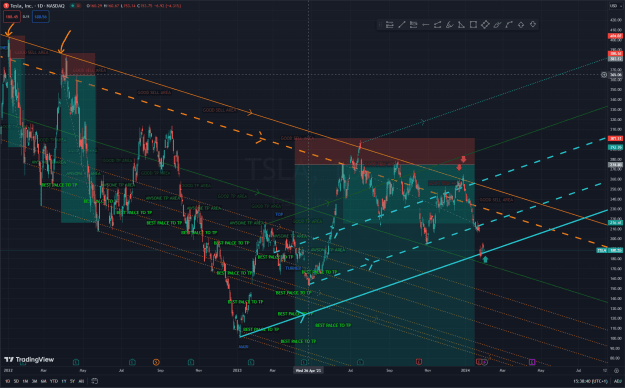
If today, Tesla keeps on going down, that will mean that its Stock will fall at least to 150, but if the trend goes on, it will be likely it can get close to he 100 zone. MAJOR loss on these stocks in a short term. Mr. Musk should do something....
{quote} {image} If today, Tesla keeps on going down, that will mean that its Stock will fall at least to 150, but if the trend goes on, it will be likely it can get close to he 100 zone. MAJOR loss on these stocks in a short term. Mr. Musk should do something....