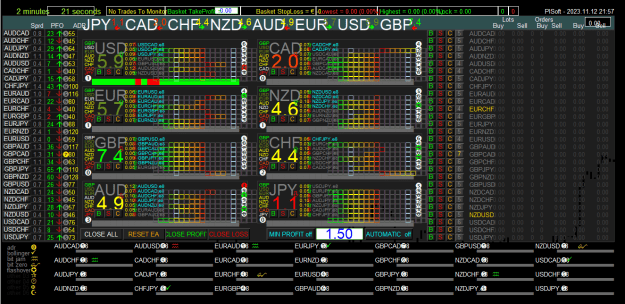
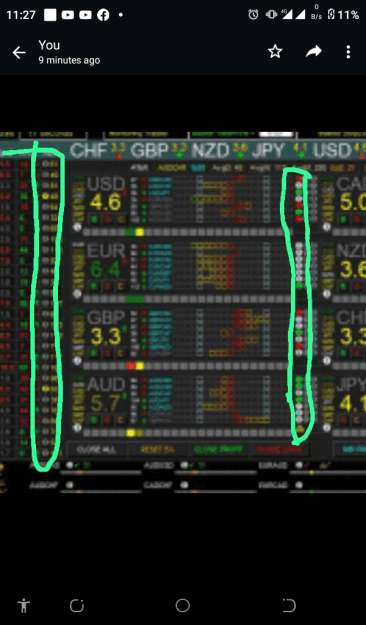
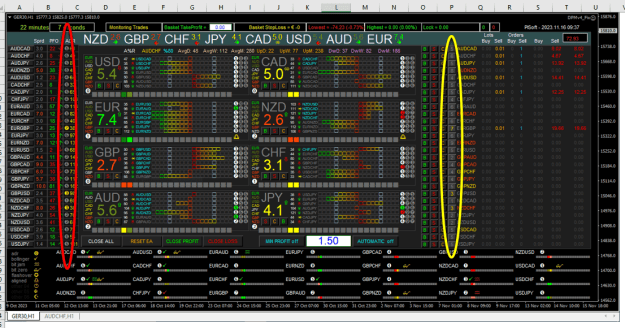
Ecco come mi cerca la dashboard. Come posso risolverlo, sono i caratteri? {immagine}
Ignored
Try this
How to return your PC screen to normal size? Hold down the Ctrl key, and then press + (plus sign) or - (minus sign) to zoom in or out on the screen. To return to normal view, hold down the Ctrl key, then press 0.
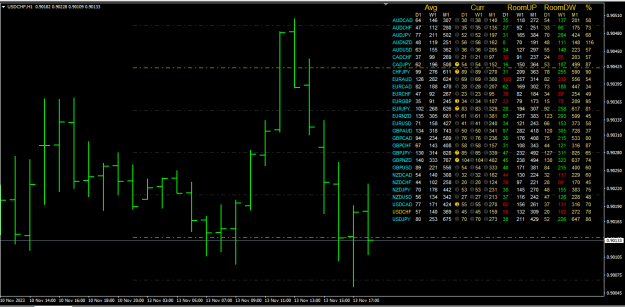
{quote} fratello, puoi aggiungere una colonna denominata "%" ed uguale a ((Current/AVG)X100) per confrontare facilmente la percentuale di movimento effettivo di oggi
{quote} The way application for AWR is usable is overbought/oversold indicator informing the trader that soon reversal may occur so entry in present trend should be limited. Then to look forward to reversal signals. Using the 3 and 7 numbering like you did with ADR is a better means to visualize AWR unlike the numbering as shown in the DWMranges indicator.
{quote} {image} {file} To try I added the DWM spheres. I think I'll add this to dash. {image}
Ignored
Great ..... a view of daily and weekly numbers can give clue for trade positioning .
The monthly doesn't offer much so option to not display it or instead of it - distance from nearest order block or fractal turncoat can be better informing replacement in the same space.
Weldone so far.
Without despair & distraught, focus on Patience to FRESH MOTiVES.
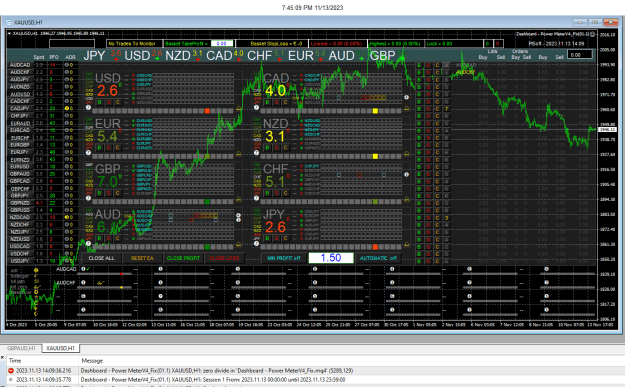
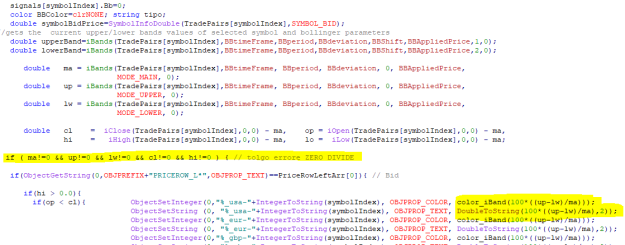
{quote} {image} From the line number I see it is repeated again within the Bollinger routine. I'll post an update with the correction in the evening. Sorry
Ignored
PlSoft
I was using the #485 version. It looks like the problem is with Traders Way. It works fine on FXChoice
thankyou
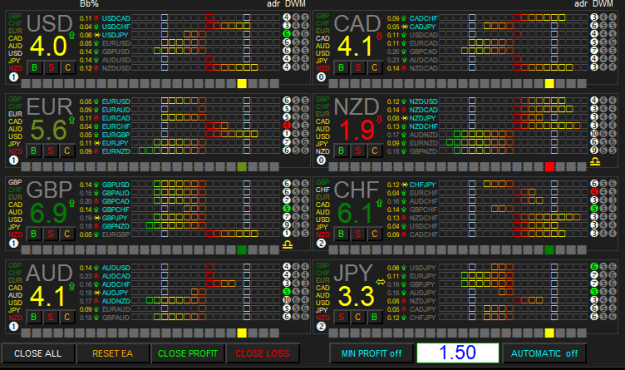
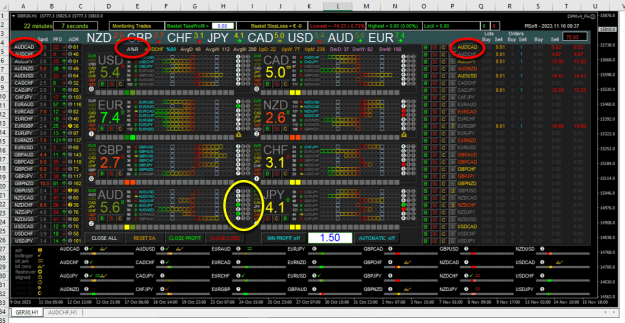
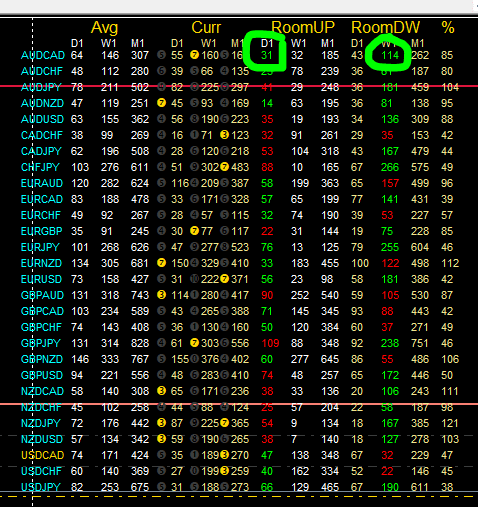
Added three ADR (DWM) ball.
The min & max ADR is divided into 10 equal parts, the ball number represents the position of the price on the part.
The parts highlighted with the circle are needed.
DX: click to open the graph (already original version)
MID: click to scroll through the different data.
SX: click to view the distances between the current price and ADR (DWM).
Update To be tested Added three ADR (DWM) ball. The min & max ADR is divided into 10 equal parts, the ball number represents the position of the price on the part. The parts highlighted with the circle are needed. DX: click to open the graph (already original version) MID: click to scroll through the different data. SX: click to view the distances between the current price and ADR (DWM). {file} {image} {image}
Ignored
Awesome.
What conditions/criteria make the balls have colour and not?
Can there be colour for any number above say 7 and below say 3?
There seems to be a duplication in ADR display:
Can be better to have an average of the balls number ((ADR balls number + AWR balls number + AMR balls number)/3) to replace the vertical ADR column since we already can see the ADR and balls number at the DWM balls display.
Attached Image (click to enlarge)
Without despair & distraught, focus on Patience to FRESH MOTiVES.
{quote} Awesome. What colours make the balls have colour and not? Can there be colour for any number above say 7 and below say 3?
Ignored
The balls will be colored in the next version.
I found it difficult to do this...
Color changing on ADR(daily) is currently handled by JamFive.
The 3/7 ADR(daily) band is colored in the right and left columns
{quote} Fantastico. Quali colori fanno sì che le palline abbiano colore e no? Può esserci colore per qualsiasi numero sopra diciamo 7 e sotto diciamo 3? Sembra che ci sia una duplicazione nella visualizzazione ADR: può essere meglio avere una media del numero di palline ((numero di palline ADR + numero di palline AWR + numero di palline AMR)/3) per sostituire la colonna ADR verticale poiché possiamo già vedere il ADR e numero di palline sul display delle palline DWM. {immagine}
Ignored
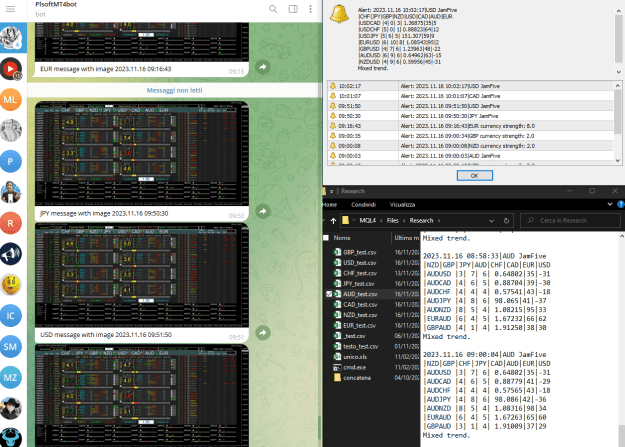
if I understood correctly (adr(D)+adr(W)+adr(M))/3
I really like this and am trying to incorporate it
{quote} if I understood correctly (adr(D)+adr(W)+adr(M))/3 I really like this and am trying to incorporate it {image}
Ignored
Yes that sort of calculation but I was envisioning it not with the actual range numbers but with the balls number e.g ball 3 in daily, ball 7 in weekly and ball -1 in monthly will give (3+7-1)/3 = ball 3....and 3 will be showed with ball.
This result can go to the dashboard power meter EA to replace the first ADR column given that the ADR balls and numbers can be seen elsewhere in the board.
Bravo to your coding capacity.
Without despair & distraught, focus on Patience to FRESH MOTiVES.
{quote} Sì, quel tipo di calcolo, ma lo stavo immaginando non con i numeri dell'intervallo effettivo ma con il numero di palline, ad esempio la pallina 3 in giornaliero, la pallina 7 in settimanale e la pallina -1 in mensile darà ( 3+7-1)/3 = pallina 3....e 3 verrà mostrato con la pallina. Questo risultato può andare al misuratore di potenza del dashboard EA per sostituire la prima colonna ADR dato che le palline e i numeri ADR possono essere visti altrove nel tabellone. Bravo per la tua capacità di codifica.