Attached Image (click to enlarge)
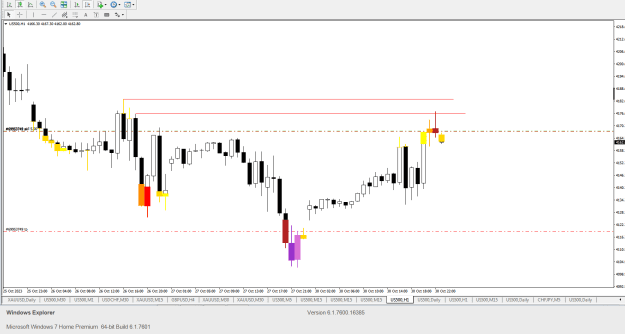
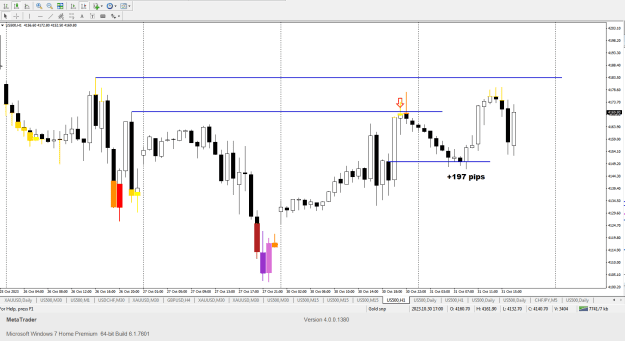
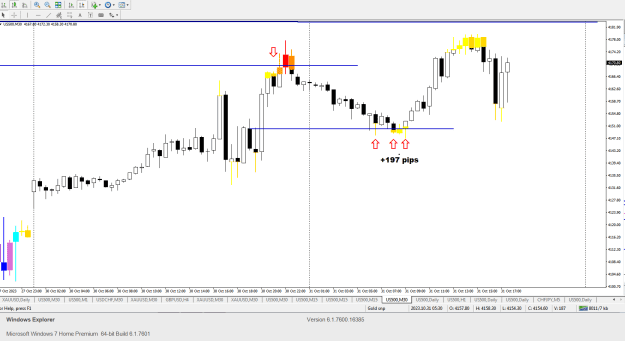
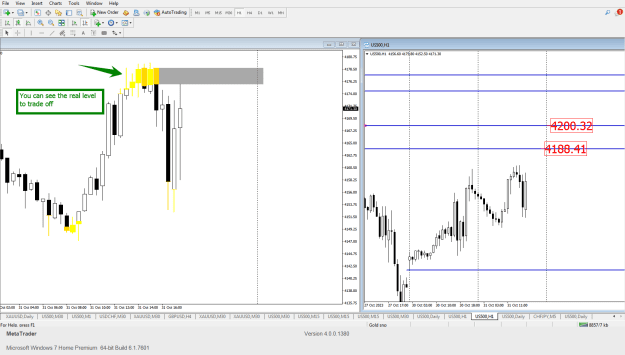
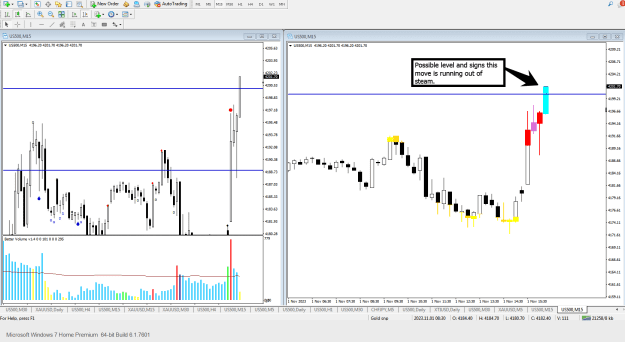
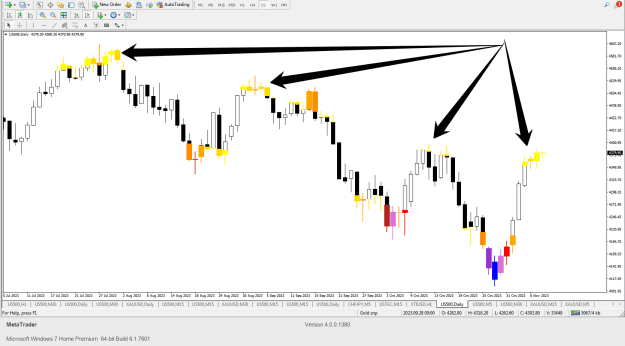
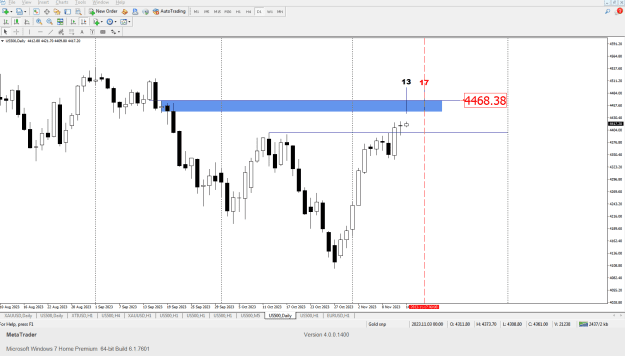
Although, on the daily chart it maybe possible we have a low on the daily chart, i am still hoping for a gap fill. The hourly chart shows how effective the candles are in identifying the possible turn. simply using support and resistance levels you can just see which levels produce the coloured candles.