AUD/JPY technical analysis (daily chart): 06/10/2023
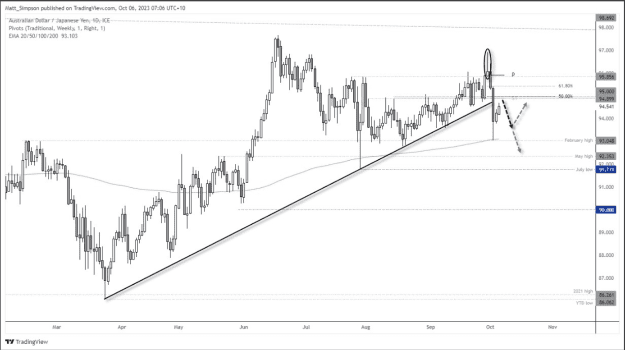
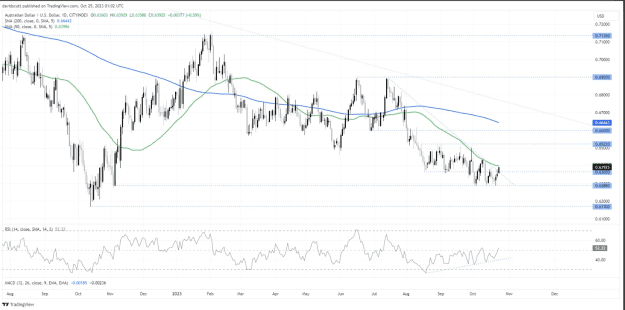
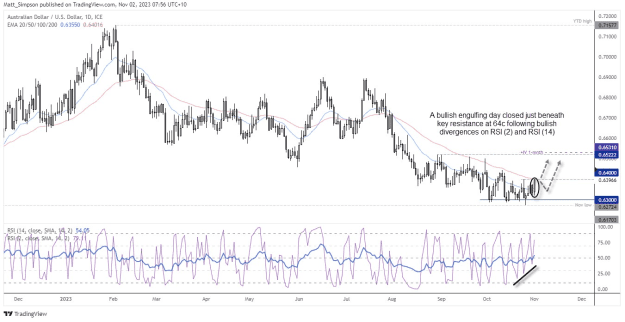
A classic barometer of risk for currency traders, AUD/JPY saw a -4% decline from Friday’s shooting star high and Tuesday’s low before the 200-day EMA and February high came to the rescue. We have since seen two modest up days, which raises the question as to whether we’re approaching an inflection point for its next leg lower – which would make this a dead-cat bounce (DCB). A true DCB would require a break of Tuesday’s low, and that would assume another round of large-scale risk-off. The reality is that I have no idea as to if that will occur, but I do suspect the pair will at least move lower initially and try and retest those lows – which itself could provide an opportunity to enter short.
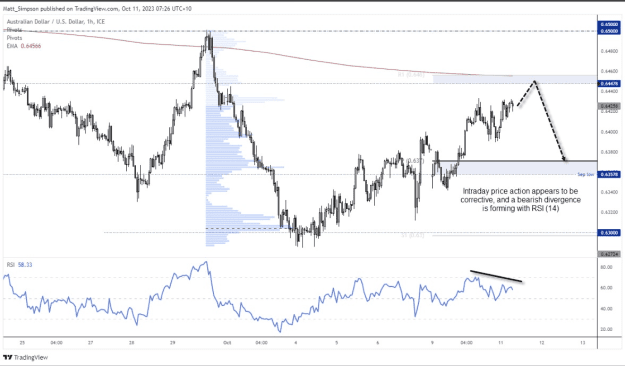
The key, if ever there was one, is to monitor lower timeframes and seek clear evidence of a momentum shift lower (for example, a bearish engulfing candle on the 1-hour,). If this occurs around resistance it can provide greater confidence a swing high is in place). Take note that the weekly S1, 50% retracement level, broken trendline and prior swing highs land around 95.0, which make it an area of interest for bearish setups.
A classic barometer of risk for currency traders, AUD/JPY saw a -4% decline from Friday’s shooting star high and Tuesday’s low before the 200-day EMA and February high came to the rescue. We have since seen two modest up days, which raises the question as to whether we’re approaching an inflection point for its next leg lower – which would make this a dead-cat bounce (DCB). A true DCB would require a break of Tuesday’s low, and that would assume another round of large-scale risk-off. The reality is that I have no idea as to if that will occur, but I do suspect the pair will at least move lower initially and try and retest those lows – which itself could provide an opportunity to enter short.
The key, if ever there was one, is to monitor lower timeframes and seek clear evidence of a momentum shift lower (for example, a bearish engulfing candle on the 1-hour,). If this occurs around resistance it can provide greater confidence a swing high is in place). Take note that the weekly S1, 50% retracement level, broken trendline and prior swing highs land around 95.0, which make it an area of interest for bearish setups.
Attached Image (click to enlarge)