Hello traders! Baxia offers the latest release of analytics on top traded assets to better understand the current market conditions for more efficient trading. Let's dive in and discuss today's market outlook on: XAUUSD!
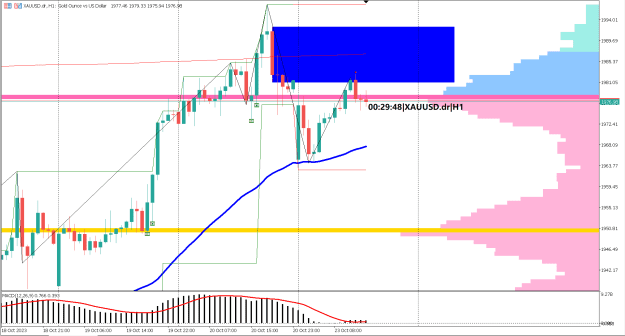
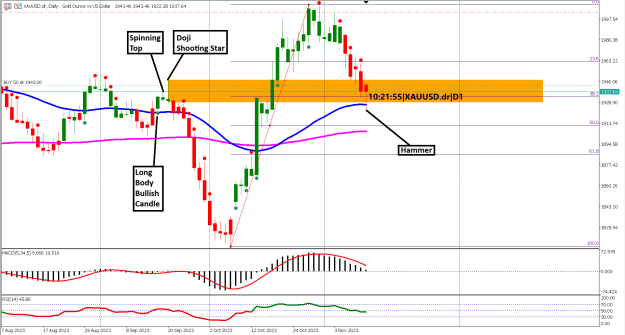
During Friday's New York trading session, the XAU/USD market encountered a notable resistance point, coinciding with the bearish candle of the evening star candlestick pattern. This resistance zone is clearly marked within a blue rectangle and spans the range of 1980-1992.
In terms of the broader trend, XAU/USD maintains a bullish trajectory as confirmed by the positioning of the EMA 50, which remains above the EMA 200. Market dynamics during the Monday Asian trading session showcased a touchpoint with support at the EMA 50, demonstrating its significance in the current context.
Adding to the market's recent movements, Monday's session commenced with a notable gap down in prices. However, over the course of the London trading session, the market managed to successfully close this gap. Notably, the EMA 200 serves as a pivotal support level, deserving careful observation in the days ahead.
Analyzing the MACD indicator, it is evident that a bullish trend is in play. This assertion is supported by the positioning of both the histogram and the signal line, which remain consistently above the zero line. A potential shift in sentiment may be anticipated if the histogram crosses below the signal line, signaling the potential for a bullish correction. However, should both of these indicators persistently cross below the zero line, a transition to bearish market conditions becomes a distinct possibility.
In summary, the XAU/USD market is currently characterized by a bullish trend, with key levels of support and resistance warranting close attention in the days to come. The MACD indicator provides further support for the prevailing bullish sentiment, but traders should remain vigilant for any shifts in the market's dynamics.
→ Click Here to READ more Market news ←
Market Analyst
Baxia Markets
_________________________________________
Twitter | Facebook | Linkedin | Instagram | YouTube
Disclaimer: Trading foreign exchange on margin carries a high level of risk, and may not be suitable for all investors. Before deciding to trade foreign exchange you should carefully consider your investment objectives, level of experience, and risk appetite. Nothing contained in this website should be construed as investment advice. Any reference to an investment's past or potential performance is not, and should not be construed as, a recommendation or as a guarantee of any specific outcome or profit
Attached Image (click to enlarge)
During Friday's New York trading session, the XAU/USD market encountered a notable resistance point, coinciding with the bearish candle of the evening star candlestick pattern. This resistance zone is clearly marked within a blue rectangle and spans the range of 1980-1992.
In terms of the broader trend, XAU/USD maintains a bullish trajectory as confirmed by the positioning of the EMA 50, which remains above the EMA 200. Market dynamics during the Monday Asian trading session showcased a touchpoint with support at the EMA 50, demonstrating its significance in the current context.
Adding to the market's recent movements, Monday's session commenced with a notable gap down in prices. However, over the course of the London trading session, the market managed to successfully close this gap. Notably, the EMA 200 serves as a pivotal support level, deserving careful observation in the days ahead.
Analyzing the MACD indicator, it is evident that a bullish trend is in play. This assertion is supported by the positioning of both the histogram and the signal line, which remain consistently above the zero line. A potential shift in sentiment may be anticipated if the histogram crosses below the signal line, signaling the potential for a bullish correction. However, should both of these indicators persistently cross below the zero line, a transition to bearish market conditions becomes a distinct possibility.
In summary, the XAU/USD market is currently characterized by a bullish trend, with key levels of support and resistance warranting close attention in the days to come. The MACD indicator provides further support for the prevailing bullish sentiment, but traders should remain vigilant for any shifts in the market's dynamics.
→ Click Here to READ more Market news ←
Market Analyst
Baxia Markets
_________________________________________
Twitter | Facebook | Linkedin | Instagram | YouTube
Disclaimer: Trading foreign exchange on margin carries a high level of risk, and may not be suitable for all investors. Before deciding to trade foreign exchange you should carefully consider your investment objectives, level of experience, and risk appetite. Nothing contained in this website should be construed as investment advice. Any reference to an investment's past or potential performance is not, and should not be construed as, a recommendation or as a guarantee of any specific outcome or profit
Baxia is a fully regulated & licensed Forex & CFD broker