• Home
  • Forums
  • Trades
  • News
  • Calendar
  • Market
  • Brokers
  • Login
  • Join
  • User/Email: Password:
  • 11:54am
Menu
  • Forums
  • Trades
  • News
  • Calendar
  • Market
  • Brokers
  • Login
  • Join
  • 11:54am
Sister Sites
  • Metals Mine
  • Energy EXCH
  • Crypto Craft

Options

Bookmark Thread

First Page First Unread Last Page Last Post

Print Thread

Similar Threads

Bag-it: A successful EA based on the Bagovino Method 554 replies

Fully Customizable Bagovino Method EA 43 replies

Newbie question about the Bagovino Method! 11 replies

"Bagovino Method" VS "Cornflower Hourly System" 16 replies

Mouteki-Bagovino-Vegas-Firebird Movie 9 replies

  • Trading Systems
  • /
  • Reply to Thread
  • Subscribe
  • 727
Attachments: Bagovino Method
Exit Attachments
Tags: Bagovino Method
Cancel

Bagovino Method

  • Last Post
  •  
  • 1 102103Page 104105106 192
  • 1 Page 104 192
  •  
  • Post #2,061
  • Quote
  • Jun 2, 2007 9:22pm Jun 2, 2007 9:22pm
  •  AbgZuhaini
  • | Joined Sep 2006 | Status: Member | 118 Posts
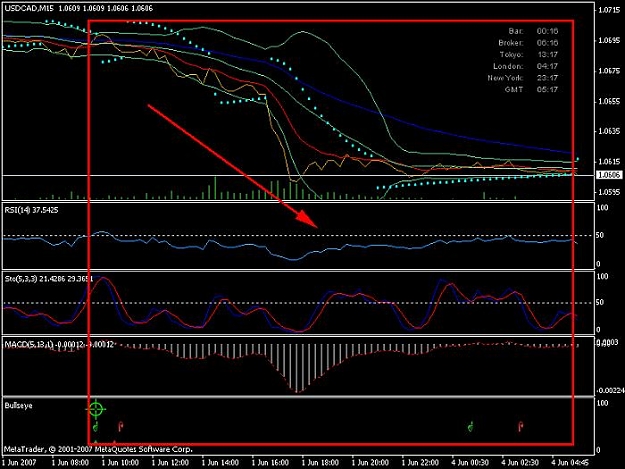
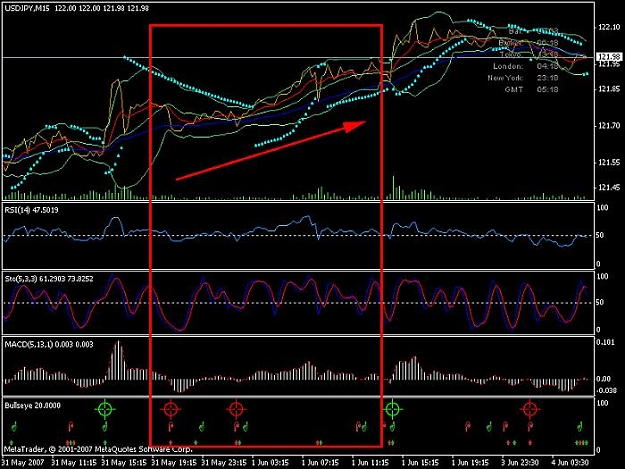
Yesterday I knocked my head and start to realise that I have done it all wrong. I have been using indicator or trading system which try to indicate reversal. I was thinking why did I try to predict a reversal while I would have tens time more chances of success if I follow the trend direction. I started to use RSI for my theory but this time I will not sell when it over 70% and buy when it below 30%, I will sell/buy when it crosses 50% depending on it direction. This way it will confirm the direction of the trend but not the reversal point. I remember this is the Bagovino method which I read 10 months ago and going to try it.
 
 
  • Post #2,062
  • Quote
  • Jun 3, 2007 1:07am Jun 3, 2007 1:07am
  •  droesparky
  • | Joined Aug 2006 | Status: Member | 149 Posts
Que I noticed the green bullseye arrow points down, not bad maybe a little confusing.
 
 
  • Post #2,063
  • Quote
  • Jun 3, 2007 2:06am Jun 3, 2007 2:06am
  •  Que
  • Joined May 2007 | Status: ??? | 1,265 Posts
They're not arrows, they're fingers, and the green one points up. If yours does not, please post a screen so I can see what you're talking about.
Que
 
 
  • Post #2,064
  • Quote
  • Jun 3, 2007 10:28am Jun 3, 2007 10:28am
  •  MarcoW
  • | Joined Mar 2007 | Status: Member | 183 Posts
Que..

Nicely done.

Many thanks.
"I know how hard it is for you to put food on your family." George W. Bush
 
 
  • Post #2,065
  • Quote
  • Jun 3, 2007 10:40am Jun 3, 2007 10:40am
  •  theFXGoods
  • | Joined Feb 2007 | Status: I make this look good! | 30 Posts
Generalz,

I agree with you on the RSI 5 indicator. I have two plotted as well. This is excellent for reversals too. I also found that you can often use double tops, 123 tops and bottoms on the RSI 5 (at certain levels that will show when the reversal takes place.


theFXGoods
 
 
  • Post #2,066
  • Quote
  • Jun 3, 2007 4:30pm Jun 3, 2007 4:30pm
  •  droesparky
  • | Joined Aug 2006 | Status: Member | 149 Posts
My bad Que, it was the cross hairs I was looking at and they at first looked like arrows that pointed the same direction.
Old eyes are nto what they used to be.
 
 
  • Post #2,067
  • Quote
  • Jun 4, 2007 12:33am Jun 4, 2007 12:33am
  •  oshioyi
  • | Joined May 2007 | Status: Member | 12 Posts
Quoting Que
Disliked
Oh, and as the Bullseye shows up on the open of the next bar, it is a very reliable way of getting in very quickly on a big move. If you notice the Red down Bullseye on the picture. I got in on the open of that bar after the alert. That bar alone was worth over 30 pips. Pic was taken on the 1H chart.
Ignored
hi, thanks for the indicator, it's GREAT visually to spot coinciding indicators.I need some help though.take a look at my charts, i highlighted some parts where the signals seem to have given wrong indications. I know it's only an indicator, but a few times, 2 RED BULLSEYE showed up on a uptrending chart.Is there anyway we can tweak it?thanks
Attached Image(s) (click to enlarge)
Click to Enlarge

Name: usdcad.jpg
Size: 66 KB
Click to Enlarge

Name: usdjpy.jpg
Size: 74 KB
 
 
  • Post #2,068
  • Quote
  • Jun 4, 2007 1:05am Jun 4, 2007 1:05am
  •  Que
  • Joined May 2007 | Status: ??? | 1,265 Posts
Quoting oshioyi
Disliked
hi, thanks for the indicator, it's GREAT visually to spot coinciding indicators.I need some help though.take a look at my charts, i highlighted some parts where the signals seem to have given wrong indications. I know it's only an indicator, but a few times, 2 RED BULLSEYE showed up on a uptrending chart.Is there anyway we can tweak it?thanks
Ignored
Im not sure how to fix the problem as I checked on my charts and it was true in an upward trending market there was two downward crossing EMA;s with corosponding RSI cross. This is exactly why this system needs discression. The indicator alone will not do it.

Here is one example I am thinking of adding to the indicator. I use this on the H1 chart, so if the closing bar that the indicator was formed had an open to close ratio of higher then 2*ATR, then the trade is not valid for that bar. In your case, One trade would have pulled 8 or so pips while the other was durring a very flat period of that trend.
Que
 
 
  • Post #2,069
  • Quote
  • Jun 4, 2007 1:41am Jun 4, 2007 1:41am
  •  strada
  • Joined Dec 2006 | Status: Member | 642 Posts
Quoting driftwood
Disliked
Hello strada - sorry I forget to ask how much stop loss you usually set at most?


DW
Ignored
Hi Driftwood,

For GU & EJ SL is 30 + spread; UJ I'm dropping down to 20 + spread because TP1 target of 30 is too ambitious most days, 20 seems more realistic.

strada
 
 
  • Post #2,070
  • Quote
  • Jun 4, 2007 1:43am Jun 4, 2007 1:43am
  •  strada
  • Joined Dec 2006 | Status: Member | 642 Posts
Quoting generalz
Disliked
Try RSI 5 cross the 50 to exit, ...as soon as that candle shows the reverse get out, almost perfect. I have two RSI indicators on my charts, 21 + 5.

generalz
Ignored
generalz, thanks for that, will check it out, cheers, strada.
 
 
  • Post #2,071
  • Quote
  • Jun 4, 2007 2:35am Jun 4, 2007 2:35am
  •  driftwood
  • | Joined Jul 2006 | Status: Member | 299 Posts
Quoting strada
Disliked
Hi Driftwood,

For GU & EJ SL is 30 + spread; UJ I'm dropping down to 20 + spread because TP1 target of 30 is too ambitious most days, 20 seems more realistic.

strada
Ignored
Many thanks to you strada.
 
 
  • Post #2,072
  • Quote
  • Jun 4, 2007 2:59am Jun 4, 2007 2:59am
  •  rorieu
  • | Joined Sep 2006 | Status: Member | 292 Posts
Morning Marco,

I asked a few questions in #2043

"Could you clarify how you use the MACD, and why two MACDs at those settings?
When you use Vegas what Fib levels do you have the lines set at? (GU & EU)
What do you use the 62MA for?
Do you use daily pivots?"

rorieu
 
 
  • Post #2,073
  • Quote
  • Jun 4, 2007 3:09am Jun 4, 2007 3:09am
  •  rorieu
  • | Joined Sep 2006 | Status: Member | 292 Posts
Good morning strada,

Any chance of you posting more real time trades (#2019), I found it very informative?

thanks
rorieu
 
 
  • Post #2,074
  • Quote
  • Jun 4, 2007 11:26am Jun 4, 2007 11:26am
  •  jeffreytp
  • | Joined Jan 2007 | Status: Member | 344 Posts
Quoting Que
Disliked
Attached is the revised alert indicator called Bullseye.mq4. Also attached is a screenshot of the indicator. Finially I attached all the indicators and the template file of the screenshoot if anyone wants to run it in the same manner as me.

The revised indicator opens in a seperate window like the RSI does. It has 3 lines. The botom line is when the RSI crosses + or -. This is designated by a green or red diamond. The middle line is when the EMA's cross + or -. This is designated by a green or red finger. The third line is when both cross in the same direction. This is designated by a green or red crosshair.

I have also made it so each event can trigger an alarm (User settable in the Inputs tab of the indicator). This is all 6 alarms, EAM cross up, EAM cross down, RSI cross up, RSI cross down, Both cross up and Both cross down.

You can also set it to send emails on each individual event just as you set the alarms. This is again settable in the Inputs tab of the indicator.

The reason I am also posting the template file is you obviously do not want to have an email or alarm every time the RSI crosses the 50. Thus, I set up 9 Bullseye indicators on the template. One for each time period on MT4. This allows you the very most customization per period by setting the alarms and emails per period.

Oh, and as the Bullseye shows up on the open of the next bar, it is a very reliable way of getting in very quickly on a big move. If you notice the Red down Bullseye on the picture. I got in on the open of that bar after the alert. That bar alone was worth over 30 pips. Pic was taken on the 1H chart.

Hope you enjoy and if you have any questions, feel free to ask.

BTW, I am in no way taking credit for Jason Robinson's work. If it were not for his origional template, I would have never altered anything to make this indicator.

Also, tyvm Bagovino for your method.
Ignored
Chart settings according to Post # 1 only on 10m time frame.

I set up the Bullseye indicator and see that the Bullseye and the EMA cross is not always indicating correctly. Look at the two images below:

Look at the Data Window on left. The 5 EMA = 12 EMA, and yet the indicator is telling us 5 EMA < 12 EMA.
Attached Image (click to enlarge)
Click to Enlarge

Name: Wrong Signal.jpg
Size: 105 KB


Loo at the Data Window. This is where the down hand and the bullseye should have signaled.
Attached Image (click to enlarge)
Click to Enlarge

Name: Correct Signal.jpg
Size: 122 KB


Can you fix this bug?
 
 
  • Post #2,075
  • Quote
  • Jun 4, 2007 11:32am Jun 4, 2007 11:32am
  •  jeffreytp
  • | Joined Jan 2007 | Status: Member | 344 Posts
I thought maybe it was the 10M that was throwing off the MA cross indicator, but it looks like it didn't work on the 15M either. Look at data window below. It shows 5 EMA = 12 EMA, NOT >.

Attached Image (click to enlarge)
Click to Enlarge

Name: Wrong Signal2.jpg
Size: 103 KB
 
 
  • Post #2,076
  • Quote
  • Jun 4, 2007 12:13pm Jun 4, 2007 12:13pm
  •  scorpion
  • | Joined Sep 2005 | Status: Member | 272 Posts
Just as an aside Jeffreytp, how do you manage to get 2 images showing up on the same post, anytime I post 2 they only show as links.

Thanks
 
 
  • Post #2,077
  • Quote
  • Jun 4, 2007 12:19pm Jun 4, 2007 12:19pm
  •  jeffreytp
  • | Joined Jan 2007 | Status: Member | 344 Posts
Quoting scorpion
Disliked
Just as an aside Jeffreytp, how do you manage to get 2 images showing up on the same post, anytime I post 2 they only show as links.

Thanks
Ignored
After you upload the image follow these steps:

Attached Image

Attached Image

Attached Image
 
 
  • Post #2,078
  • Quote
  • Jun 4, 2007 12:22pm Jun 4, 2007 12:22pm
  •  jeffreytp
  • | Joined Jan 2007 | Status: Member | 344 Posts
Quoting Que
Disliked
Attached is the revised alert indicator called Bullseye.mq4. Also attached is a screenshot of the indicator. Finially I attached all the indicators and the template file of the screenshoot if anyone wants to run it in the same manner as me.

The revised indicator opens in a seperate window like the RSI does. It has 3 lines. The botom line is when the RSI crosses + or -. This is designated by a green or red diamond. The middle line is when the EMA's cross + or -. This is designated by a green or red finger. The third line is when both cross in the same direction. This is designated by a green or red crosshair.

I have also made it so each event can trigger an alarm (User settable in the Inputs tab of the indicator). This is all 6 alarms, EAM cross up, EAM cross down, RSI cross up, RSI cross down, Both cross up and Both cross down.

You can also set it to send emails on each individual event just as you set the alarms. This is again settable in the Inputs tab of the indicator.

The reason I am also posting the template file is you obviously do not want to have an email or alarm every time the RSI crosses the 50. Thus, I set up 9 Bullseye indicators on the template. One for each time period on MT4. This allows you the very most customization per period by setting the alarms and emails per period.

Oh, and as the Bullseye shows up on the open of the next bar, it is a very reliable way of getting in very quickly on a big move. If you notice the Red down Bullseye on the picture. I got in on the open of that bar after the alert. That bar alone was worth over 30 pips. Pic was taken on the 1H chart.

Hope you enjoy and if you have any questions, feel free to ask.

BTW, I am in no way taking credit for Jason Robinson's work. If it were not for his origional template, I would have never altered anything to make this indicator.

Also, tyvm Bagovino for your method.
Ignored
Can you please post a Bullseye version with the RSI, EMA, & BULLSEYE indicator effective as of the bar/candle close vs the open? I think this may be more effective.
 
 
  • Post #2,079
  • Quote
  • Jun 4, 2007 6:57pm Jun 4, 2007 6:57pm
  •  Que
  • Joined May 2007 | Status: ??? | 1,265 Posts
I am looking at code to change the way alerts and emails are currently sent. As it is every update of the MT4 client it looks to see if it is durring the current bar. Thus you can get slammed with emails and alerts.

I am trying to see how to make it the close of the bar as you have said, but I have been a little busy.
Que
 
 
  • Post #2,080
  • Quote
  • Jun 4, 2007 7:10pm Jun 4, 2007 7:10pm
  •  osirisisis
  • | Joined Apr 2007 | Status: Member | 69 Posts
If the cross on the emas has happened but the cross on the rsi has not and then 2 to 3 candles latter the cross on rsi happens or vis versa, is the trade still a go?

Im reading that when using 10min 15 min or 30 min charts with this strat that direction is important. How is direction determend? If Im using a 10 min chart is direction going to be the last 10 candles, 25 candles, 100 candles ?

Thanks for the help
 
 
  • Trading Systems
  • /
  • Bagovino Method
  • Reply to Thread
    • 1 102103Page 104105106 192
    • 1 Page 104 192
0 traders viewing now
  • More
Top of Page
  • Facebook
  • Twitter
About FF
  • Mission
  • Products
  • User Guide
  • Media Kit
  • Blog
  • Contact
FF Products
  • Forums
  • Trades
  • Calendar
  • News
  • Market
  • Brokers
  • Trade Explorer
FF Website
  • Homepage
  • Search
  • Members
  • Report a Bug
Follow FF
  • Facebook
  • Twitter

FF Sister Sites:

  • Metals Mine
  • Energy EXCH
  • Crypto Craft

Forex Factory® is a brand of Fair Economy, Inc.

Terms of Service / ©2023