{quote} @Bazenga had given a clear and comprehensive take on these scenarios on post #322.
Ignored
Thank you for that. How do you now this thread like the back of ur hand? I went through all the pages but that is so much information and there is no way to absorb it at once.
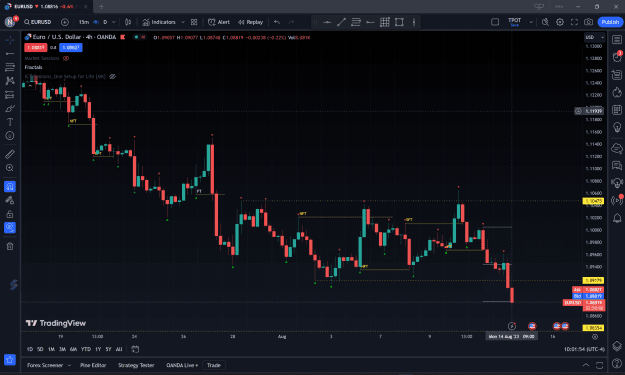
Counter bias long after extended sweep, NYKZ
Strong impulsive move down, but it already did its average daily range. Target 3R but may consider moving to breakeven if price reach 2R.
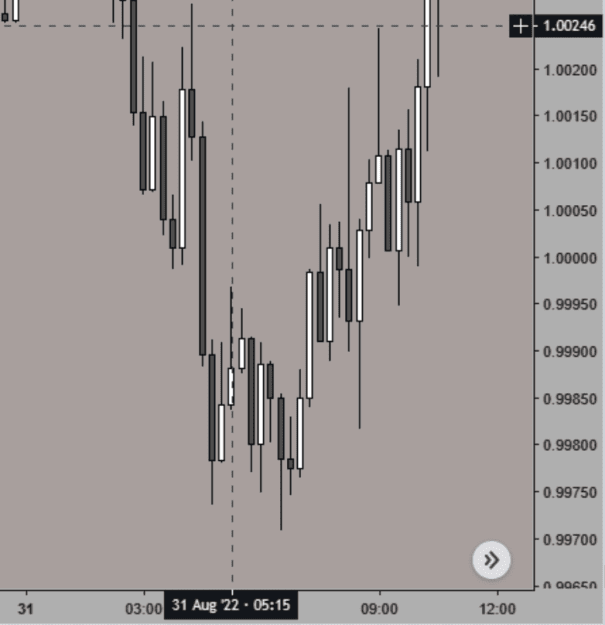
EURUSD FT Short Bias {image} Counter bias long after extended sweep, NYKZ Strong impulsive move down, but it already did its average daily range. Target 3R but may consider moving to breakeven if price reach 2R. {image} Update: TP Hit +3R {image}
Ignored
NICE!!!
I hope I may ask you three questions:
- Where do you get the ADR (Average Daily Range) ? I've tried before to get an indicator with no luck.
- How many pips you add on EU & GU for your SL? 1? 2? 3? (I tried calculating by myself but not visible on your screenshots)
- What is ICT One Setup For Life?
{quote} NICE!!! I hope I may ask you three questions: - Where do you get the ADR (Average Daily Range) ? I've tried before to get an indicator with no luck. - How many pips you add on EU & GU for your SL? 1? 2? 3? (I tried calculating by myself but not visible on your screenshots) - What is ICT One Setup For Life?
Ignored
The ADR indicator I used was meant for MT4. I downloaded from this thread in FF.
I use 2 pips for EU, and 3 pips for GU (refer to the most recent video where Scott did a recap on GU, and said that he used +3pip for GU). In my screenshot, the SL can be seen on the vertical price axis on the right side of the chart. It was the red level of 1.08720. Similarly, the entry was grey color showing the price 1.08850.
Please ignore this indicator, I made it invisible as I am not using it after testing it. I was testing this indicator to see if it can display the KZs in a clearer manner, and if there would be some opening levels or session range high/low that might be useful. But I ended up sticking to the Market Sessions and Fractal indicator only, as it did not seemed to add value to this strategy.
Quick note: My current approach to SL is not to be so stress/strict about calculating it. For example, when I drag the risk/rewards tool to the candle high and low, the SL distance on my chart was 10.2pip. I simply round it up to 11pip and then add 2pip to make it 13pip. I do not want to stress myself doing the math to set an exact SL of 12.2pip.
{quote} The ADR indicator I used was meant for MT4. I downloaded from this thread in FF. I use 2 pips for EU, and 3 pips for GU (refer to the most recent video where Scott did a recap on GU, and said that he used +3pip for GU). In my screenshot, the SL can be seen on the vertical price axis on the right side of the chart. It was the red level of 1.08720. Similarly, the entry was grey color showing the price 1.08850. Please ignore this indicator, I made it invisible...
Ignored
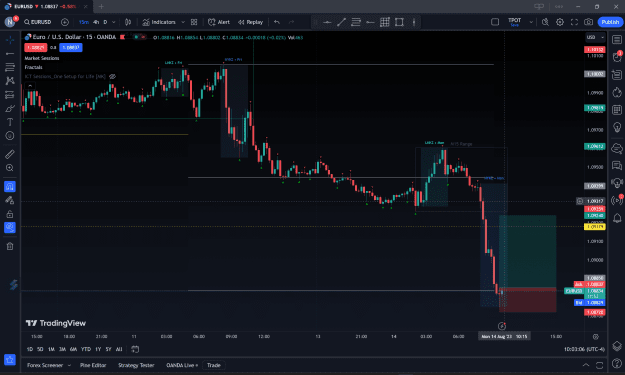
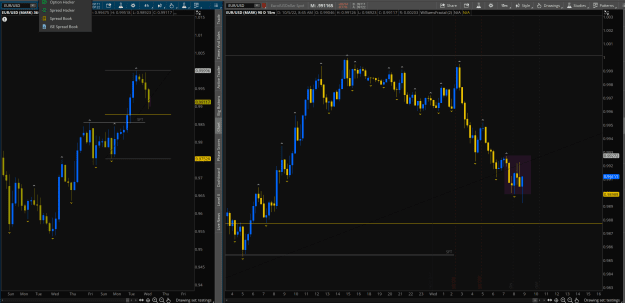
1. My platform is TOS, and it has its own language -thinkScript, like TradingView's pineScript. In the pic below, on the righthand side 15m chart you'll see in the top left corner a blue box for the ADR. That's what I found so far. It's a custom indicator that I must tweak a bit because I think it is for stocks. But before I commit few hours in trying to achieve that, I must ask if you often use it as a confirmation?
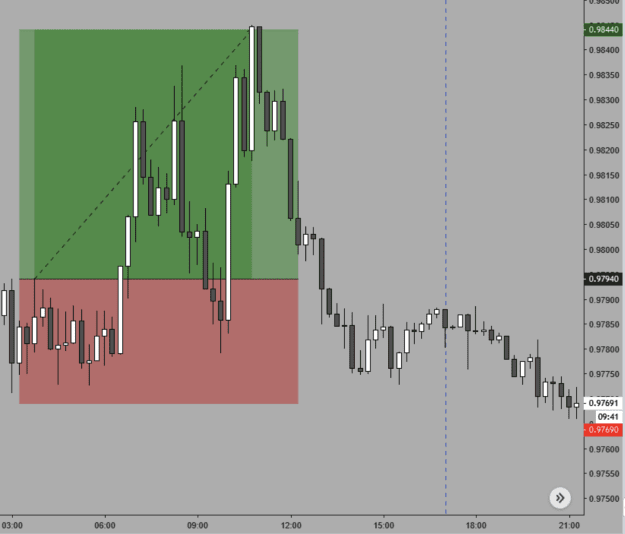
2. I saw Scott's latest video and that was a good one for me. But I often find myself in situations where 2 pips are not enough. Like the example below. You'll see that candle A is sweep extension, candle B is an inside bar (thank you for mentioning that to me) but entry was still valid, then candle C triggered me in, and candle D dropped to just 0.4 pips above my SL. And my SL was candle A's low rounded down minus 3 pips. And this is not the only example, but the most recent one I came across. So, do you find 2 pips enough for your trades in general on EU?
3. In the example as you can see A is last candle for LDN session and B did not trigger me in. but C is. Is this still a valid setup?
{quote} 1. My platform is TOS, and it has its own language -thinkScript, like TradingView's pineScript. In the pic below, on the righthand side 15m chart you'll see in the top left corner a blue box for the ADR. That's what I found so far. It's a custom indicator that I must tweak a bit because I think it is for stocks. But before I commit few hours in trying to achieve that, I must ask if you often use it as a confirmation? 2. I saw Scott's latest video and that was a good one for me. But I often find myself in situations where 2 pips are not enough....
Ignored
No no no! Sorry to have mentioned about the ADR. I don't usually refer to it, actually that was first time since I started using TPOT; but for that trade, price was strongly bearish, and the extended sweep was over many candles already. I recalled Scott's video mentioning about if we felt that price had over extended, we could choose to counter trade it. I was not too confident and wanted an additional reason to support the narrative, that's when I open MT4 and drop in the indicator to have a look and saw that the daily range was exceeded. The ADR + the little pin bar gave me a bit of assurance when placing my pending order. That said, without considering all these, trading TPOT as it was, would still work out well.
I will be careful not to mention extras that were not part of this strategy in future.
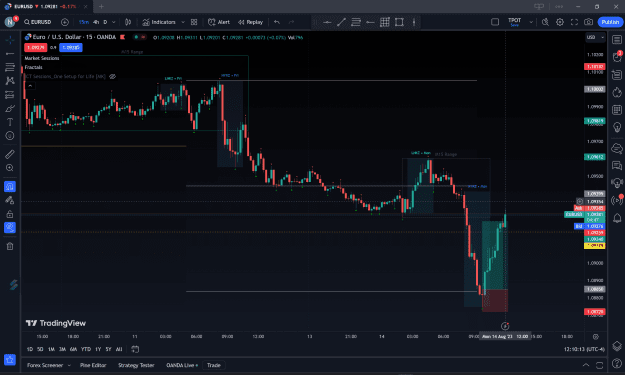
I am using free tier of TradingView and could not go back so far to Aug 2022. However, I used another platform to open up a naked chart although it has no fractal and no session indicators. I assume exactly 1 year ago the timezone/daylight-saving would be the same as today, it meant there might not be an entry as it was outside of London Killzone. Based on the screenshot, the candle that trigger the entry was the 5:15 NY candle. That might have prevented a loss. However, hitting your SL by 1 or 2 pip and going all the way to TP would still happen. Even if you use 5 more pip to the SL to all your trades, there will be similar cases where it just took you out and went your way. Also, every pip cushion we add to the SL, the TP will be 3 more pips further away.
Attached Image (click to enlarge)
To me, once KZ ended I stopped looking for entries. So I probably would not enter at C.
{quote} No no no! Sorry to have mentioned about the ADR. I don't usually refer to it, actually that was first time since I started using TPOT; but for that trade, price was strongly bearish, and the extended sweep was over many candles already. I recalled Scott's video mentioning about if we felt that price had over extended, we could choose to counter trade it. I was not too confident and wanted an additional reason to support the narrative, that's when I open MT4 and drop in the indicator to have a look and saw that the daily range was exceeded....
Ignored
1. I was looking for ADR long before I found TPOT. The best I found was a chart from a shady website with what they claim to be data from the last 20 years. But at the same time latest data was from 2019 so pre-covid and pre-war.... in other words, before "shit hit the fan" days. So, I think using ADR as an excuse to go into a trade is not senseless & careless at all.
2. I guess you are at the point where you simply accept the fact that you play a game you are not in control of, and you have to play by Banks rules and bite the dust occasionally. I am still new and being the stubborn noob that thinks he is very smart. I'll get over this one day.
3. This was a test-trade. I remember one of Scott's examples where he had LQ sweep on the last KZ candle and very next one triggered him in. He said that is still a valid entry because setup was formed during KZ. However, my example was the 2nd candle after KZ. What can I say, a noob trying to beat the game.
{quote} 1. I was looking for ADR long before I found TPOT. The best I found was a chart from a shady website with what they claim to be data from the last 20 years. But at the same time latest data was from 2019 so pre-covid and pre-war.... in other words, before "shit hit the fan" days. So, I think using ADR as an excuse to go into a trade is not senseless & careless at all. 2. I guess you are at the point where you simply accept the fact that you play a game you are not in control of, and you have to play by Banks rules and bite the dust occasionally....
Ignored
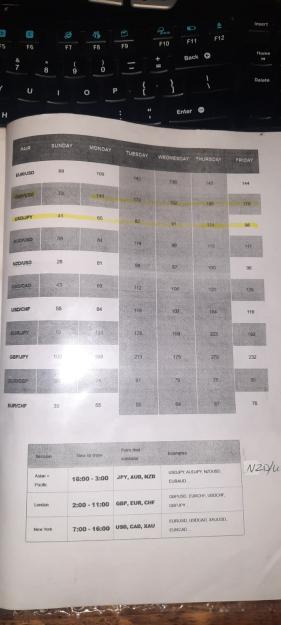
This hardcopy chart you have is quite similar to the one from Babypips.
Here is a site that might be helpful, but it is by year instead of day of week.
{quote} This hardcopy chart you have is quite similar to the one from Babypips. Here is a site that might be helpful, but it is by year instead of day of week.
Ignored
May I ask you, when backtesting TPOT, how many trades you have per month? On average? Not asking for Wins or Losses, but trades overall.
{quote} About 8 per month. This week had more, there were around 3 to 4 setups if I am not wrong, although I only took 1 trade so far.
Ignored
Ok, so I am not wrong. I got 8 trades per month for 5 months of backtesting.
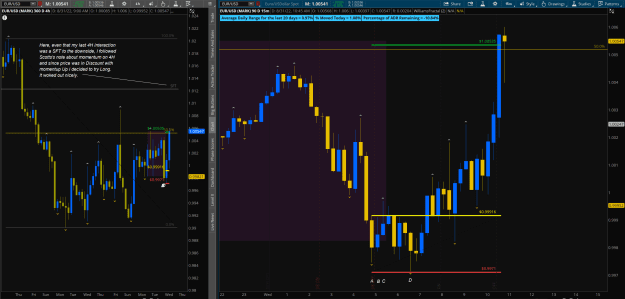
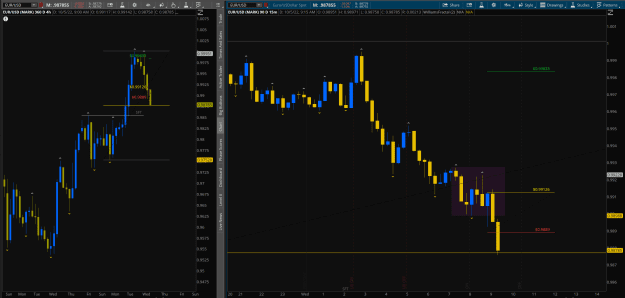
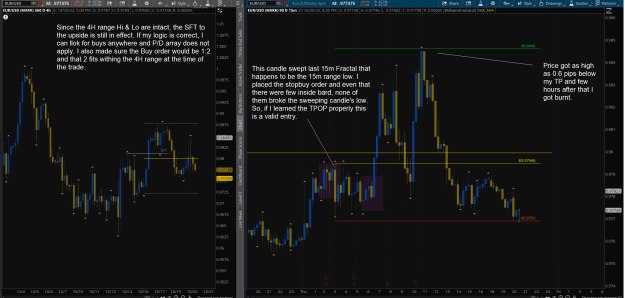
I wanna ask you this. Look at the screenshot. SO, I have a SFT but price made a Fractal High on 4H. After this fractal is formed do I still go for Long anywhere in the P/D array? Or now I wayt for price to drop below EQ and look for long? Or wait for the price to interact with a 4H fractal?
{quote} Ok, so I am not wrong. I got 8 trades per month for 5 months of backtesting. I wanna ask you this. Look at the screenshot. SO, I have a SFT but price made a Fractal High on 4H. After this fractal is formed do I still go for Long anywhere in the P/D array? Or now I wayt for price to drop below EQ and look for long? Or wait for the price to interact with a 4H fractal? P.S>. This is 10/05/2022 {image}
Ignored
Even after the 4 hour fractal high was printed, your bias was still SFT until eventually, either the 4 hour fractal high or low was interacted. I am not sure if there was a counter bias setup for sell based nearer to the range high, but yes you could still long anywhere mechanically.
However, so far I felt SFT win rate wasn't as good as NFT or FT.
{quote} ... so far I felt SFT win rate wasn't as good as NFT or FT.
Ignored
I have the same feeling and I thought I was doing something wrong or it had something to do with new 4h Fractal being printed. I even adobted the 1:2 RR rule with SFT, just as a precaution. With the above example here is what happened - thiggered me in and then BANG! Right in the back of the head.
Counter NFT Short
Counter bias trade. Targeting 3R but may lower to 2R if needed.
Attached Image (click to enlarge)
Update. SL Hit
Interesting trade. Counter trade if target 2R only would be successful. There was also a long trade (which I did not take) that would have yield 3R.
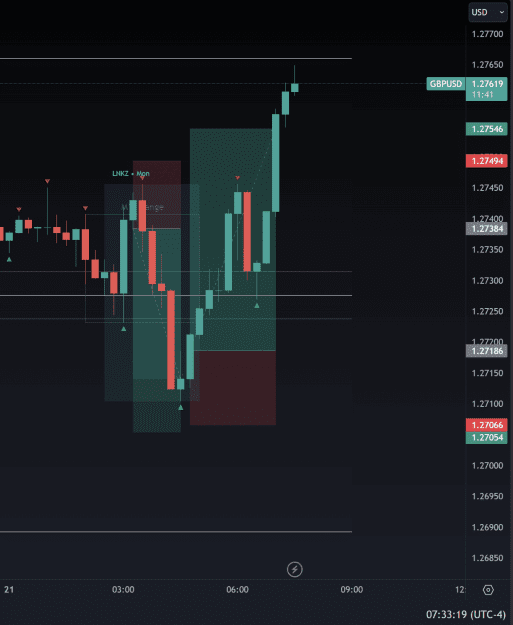
GBPUSD H4 NFT Long Bias 4 hour in a range {image} Counter NFT Short Counter bias trade. Targeting 3R but may lower to 2R if needed. {image} Update. SL Hit Interesting trade. Counter trade if target 2R only would be successful. There was also a long trade (which I did not take) that would have yield 3R. {image}
Ignored
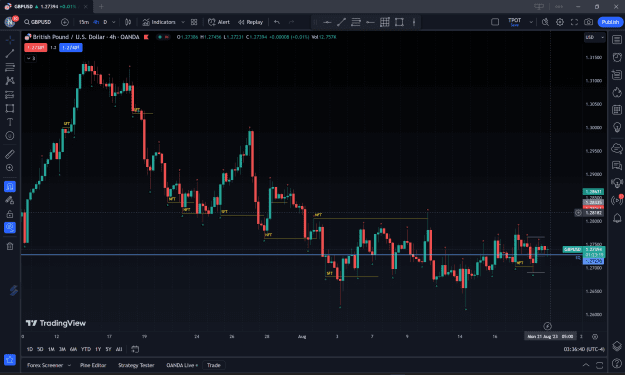
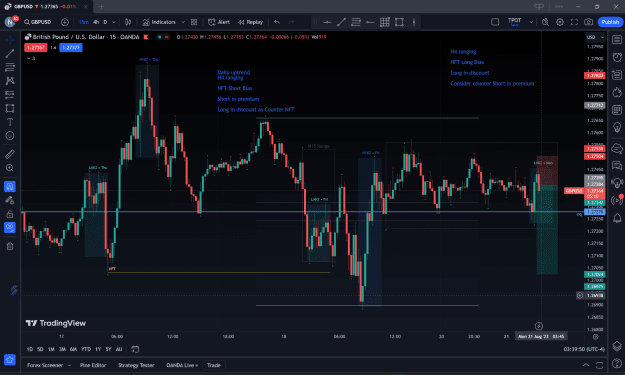
1) Why the Long Bias on GU? There was a NFT to the downside, but at the same time momentum was to the down. three consecutive LH and two LL. Why the bullish bias?
2) On that short that did not work out - was ur SL 5.3 pips above the entry candle's High? If it was 5.3 may I assume that you round up from 1.27441 to 1.2745, then add 3 pips SL and add the spread for a total of 5.3? (1.27494)
{quote} 1) Why the Long Bias on GU? There was a NFT to the downside, but at the same time momentum was to the down. three consecutive LH and two LL. Why the bullish bias? 2) On that short that did not work out - was ur SL 5.3 pips above the entry candle's High? If it was 5.3 may I assume that you round up from 1.27441 to 1.2745, then add 3 pips SL and add the spread for a total of 5.3? (1.27494)
Ignored
The bias in TPOT is always based on the interaction of the 4-hour range high/low. So as shown in my screenshot it was NFT to the downside, which means long bias. Sticking to the primary setup, we would take the long trade if the setup present itself. When you mentioned momentum was down, were you talking about the general 4-hour trend? You were right that it was in a down trend but (since beginning of Aug) now I can only see it was ranging without direction. In addition, this might be out of scope of TPOT, but if you switch to Daily chart, I felt it was in a uptrend and now at the lower part of a correction. Also, the GU long entry which I did not take, it was a trade that was officially taken by Evolution Market, which can be found posted in their social media.
My SL was larger because I used the next higher fractal that you can find to the left (about 10 candles I think) of the setup candle.