After 3 months of a lot of coding, testing and difficulties in creating variables that until then were non-existent, I finally managed to create an indicator that proves to be the real holy grail for any type of liquid market.
Anyone who follows me on FF must have already understood that the way in which I develop indicators is quite different.
That's why I always try to create in a very technical way what hasn't crossed the minds of many programmers and traders.
I know everyone is looking for the perfect tool and to be honest: I'm a little tired of repeated questions about how my indicators work.
Believe me, even if I reported every detail it would not be possible to develop it, even the language used by the platforms has at times the difficulty of understanding them, making me simplify a good part of the code so that they can finally compile and recognize it.
Not that the language is wrong, but that it has so many details that make it too complex for even a machine like the metatrader or tradingvew servers to have exhaustion and delays when executing the strategy.
This is because the platform logic needs to understand how the code is described and then analyze it according to the information sent to the data packet, so there is a need for a high processing speed that at this point is shared with millions from people around the world for being pioneering companies with millions of customers.
But of course, that doesn't mean we can't create something that at least solves the problem of simple users who just want to buy and sell in their operations and don't need complex analysis, just that the graph shows the information for buying here or selling there. and for them it is perfect.
Just to get to this point in the reading, many had to make a huge effort and others gave up along the way and of course this is on purpose, but have faith, all the information I am sharing here with you will be worth it.
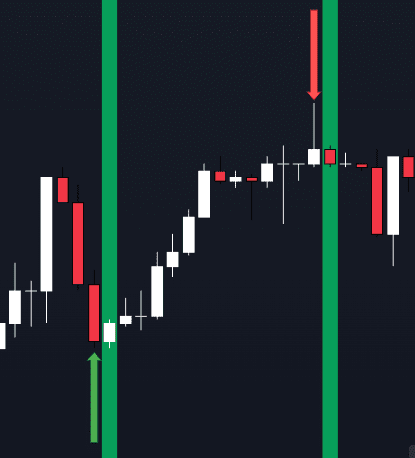
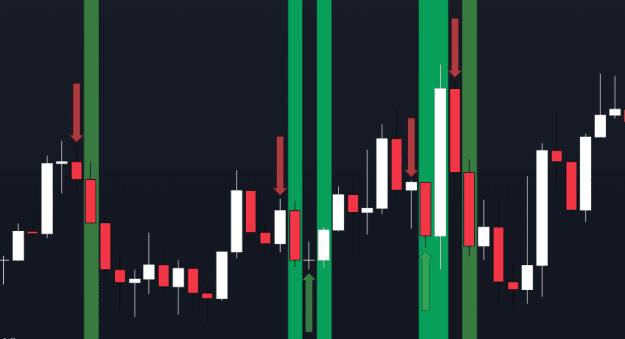
My main objective here is to turn 3 months of complete and variable information that would take light years to understand into a simple on-screen visual, with just an up arrow and a down arrow after the indicator has already done all the heavy lifting to indicate that the and yes the best time for you to negotiate.
So for forex market lovers who trade in scalper mode or who are even committed to trading on proprietary tables, this will suit you very well, as it will simplify your life.
Binary options lovers, although many have a huge precociousness about it, will finally be able to make their 10 x 0 and show their friends how good you are at something.
For internal markets such as the stock exchanges of each country such as the Brazilian stock exchange as an example, where high volatility indices, many times higher than that of bitcoin, drive operators crazy for not knowing whether to give up on the day trade, when launching this indicator on the chart you will be surprised to see that even in dire market times it will give you the right guidance on what to do.
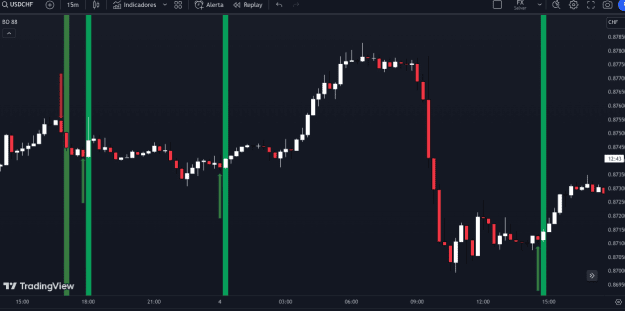
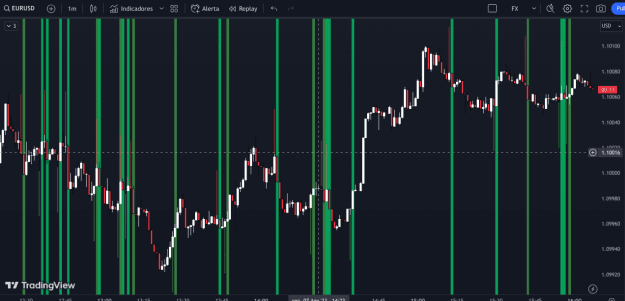
During all this period of development, modifications and finally reaching what can be considered something worthy, I analyzed many, many assets on tradingvew using the indicator, there were many and many and from almost all countries that today have a liquid economy on the stock exchange on all types of instruments.
I know that this will bring joy to many and will lead many to dream again of at least a dignified life for themselves and their families.
From the depths of my being, I hope this is helpful to you and that your days of difficulty are over and you succeed in your journey.
Here I leave the best of me, for all of us...
Anyone who follows me on FF must have already understood that the way in which I develop indicators is quite different.
That's why I always try to create in a very technical way what hasn't crossed the minds of many programmers and traders.
I know everyone is looking for the perfect tool and to be honest: I'm a little tired of repeated questions about how my indicators work.
Believe me, even if I reported every detail it would not be possible to develop it, even the language used by the platforms has at times the difficulty of understanding them, making me simplify a good part of the code so that they can finally compile and recognize it.
Not that the language is wrong, but that it has so many details that make it too complex for even a machine like the metatrader or tradingvew servers to have exhaustion and delays when executing the strategy.
This is because the platform logic needs to understand how the code is described and then analyze it according to the information sent to the data packet, so there is a need for a high processing speed that at this point is shared with millions from people around the world for being pioneering companies with millions of customers.
But of course, that doesn't mean we can't create something that at least solves the problem of simple users who just want to buy and sell in their operations and don't need complex analysis, just that the graph shows the information for buying here or selling there. and for them it is perfect.
Just to get to this point in the reading, many had to make a huge effort and others gave up along the way and of course this is on purpose, but have faith, all the information I am sharing here with you will be worth it.
My main objective here is to turn 3 months of complete and variable information that would take light years to understand into a simple on-screen visual, with just an up arrow and a down arrow after the indicator has already done all the heavy lifting to indicate that the and yes the best time for you to negotiate.
So for forex market lovers who trade in scalper mode or who are even committed to trading on proprietary tables, this will suit you very well, as it will simplify your life.
Binary options lovers, although many have a huge precociousness about it, will finally be able to make their 10 x 0 and show their friends how good you are at something.
For internal markets such as the stock exchanges of each country such as the Brazilian stock exchange as an example, where high volatility indices, many times higher than that of bitcoin, drive operators crazy for not knowing whether to give up on the day trade, when launching this indicator on the chart you will be surprised to see that even in dire market times it will give you the right guidance on what to do.
During all this period of development, modifications and finally reaching what can be considered something worthy, I analyzed many, many assets on tradingvew using the indicator, there were many and many and from almost all countries that today have a liquid economy on the stock exchange on all types of instruments.
I know that this will bring joy to many and will lead many to dream again of at least a dignified life for themselves and their families.
From the depths of my being, I hope this is helpful to you and that your days of difficulty are over and you succeed in your journey.
Here I leave the best of me, for all of us...