This is not to be confused with the other system "ISR Method"
all suggestions, modifications, adjustments, and additions welcomed
"The idea is inspired by ICT (Inner Circle Trader) concepts where price is always seeking "liquidity" by reaching for trivial pivots where the average retail trader would put their stop loss. When price seeks these levels and stops out these traders, you might expect an influx of volume due to the high number of shares/contracts being exchanged. And when there is an above-average spike in volume at these prices, it's possible to assume "smart money" may be buying retail's sell stops and vice versa. This is just my interpretation - I'm aware that ICT doesn't use volume as part of his analysis, and often advocates against using volume altogether, however I personally find it to be a great analytical tool in this context."
In my opinion this works best on 1m and smaller timeframes. Volume gets very diluted on timeframes greater than 1-3 minutes. It's easier to find volume spikes on very small timeframes like the 15s.
System doesn't require any unique indicators but someone did create a free custom indicator for the system (https://www.tradingview.com/script/pxCIz9Fh-Inducement-Stop-Hunt-TFO/#:~:text=The%20idea%20is%20inspired%20by%20ICT%20%28Inner%20Circle,to%20the%20high%20number%20of%20shares%2Fcontracts%20being%20exchanged.) on TradingView
__________________________________________________________________________________________________________________
Timeframe: Any for now until we can decisively determine a superior time frame
Useful Indicators:
Pivot Points: Can help you identify structure breaks and swing points
Volume Spikes: Can help you identify when price surges for stop hunts
Swing Points, HL,LH: If you chose to not use B.O.S and just want to identify these areas for entries
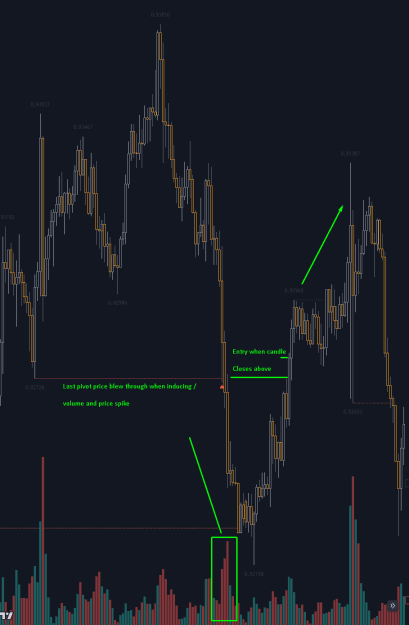
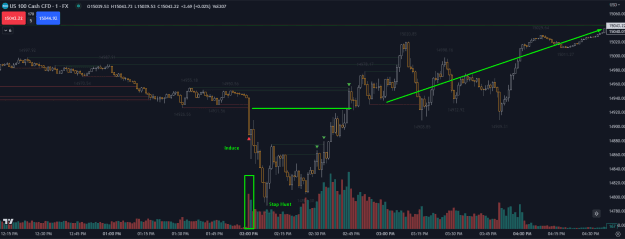
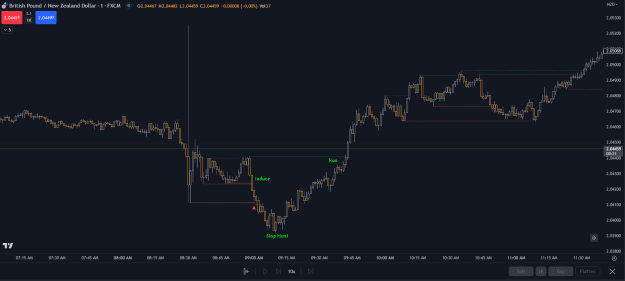
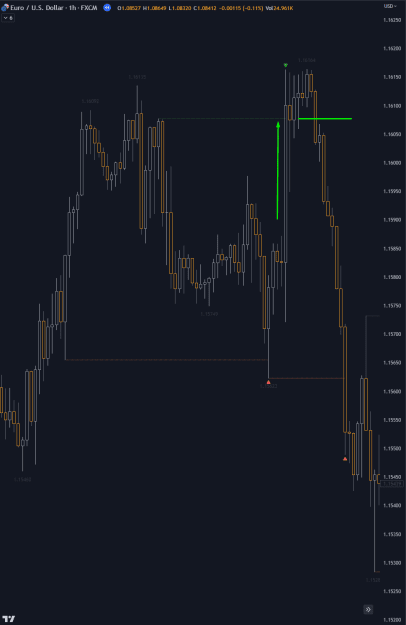
Long Entry Example:
Induce: Spike in volume, suddenly pushing price and breaking structure / or a prior swing low
Stop Hunt: Shortly after price surges, and takes out most traders stop loss, price will start to get bullish momentum
Run: Enter when a candle closes above the swing low
- stop loss is at the discretion of the trader -
Notes:
If you need help identifying which pivot,(for buy example) its the last one price closed below when it made a big volume spike
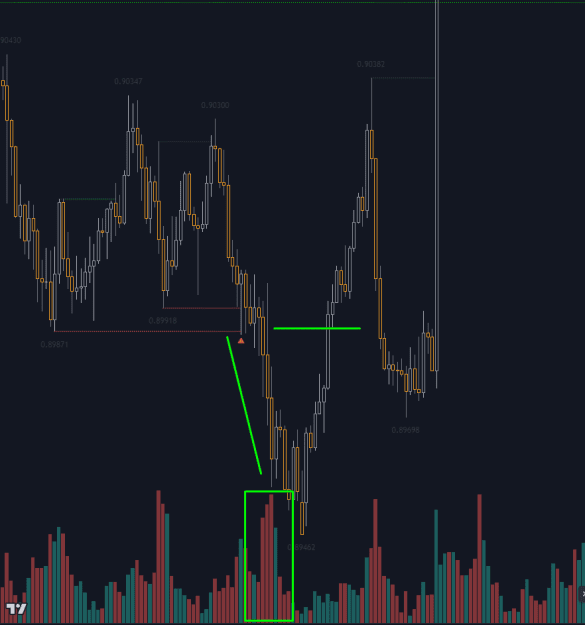
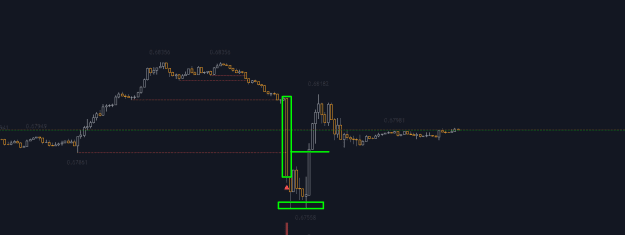
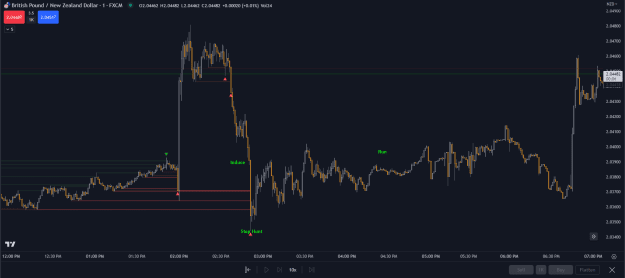
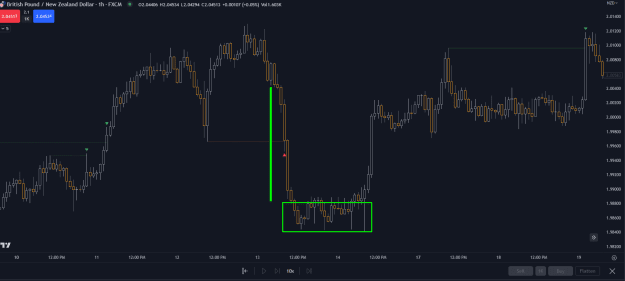
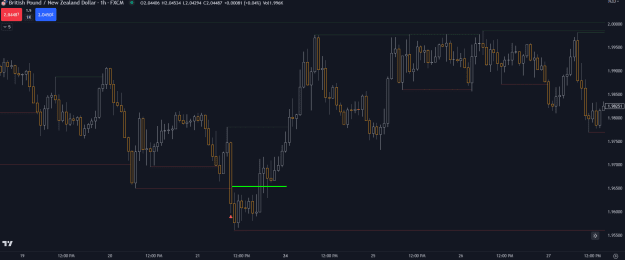
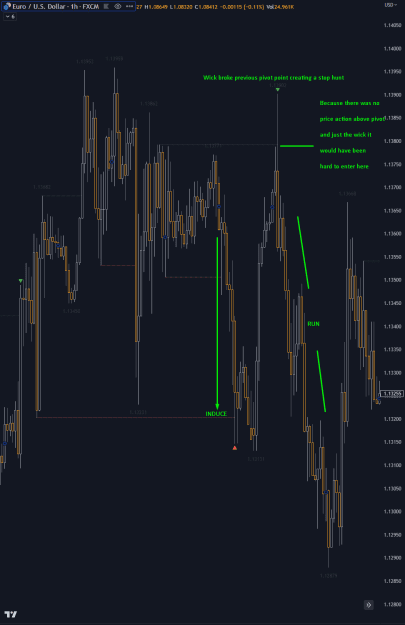
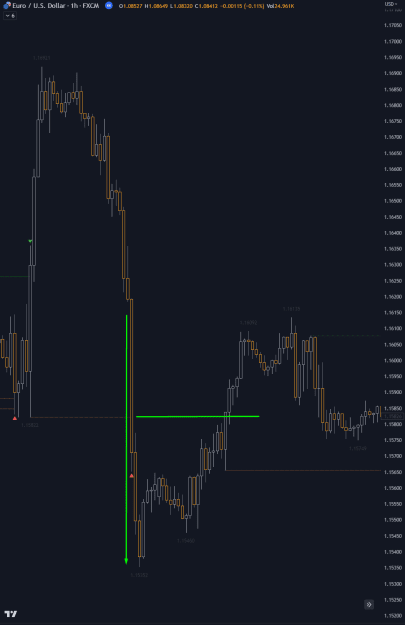
STOP HUNTS: Stop Hunts can present themselves differently. Sometimes, It can be one singular LONG wick that stops traders out, and sometimes price can break the swing point and consolidate a bit before making a run.
Here are some random examples to help you understand:
Wick Stop Hunt:
Stop Hunt that breaks Pivot and consolidates before running:
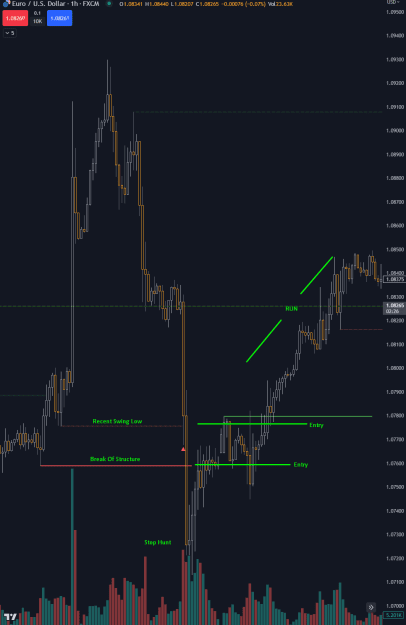
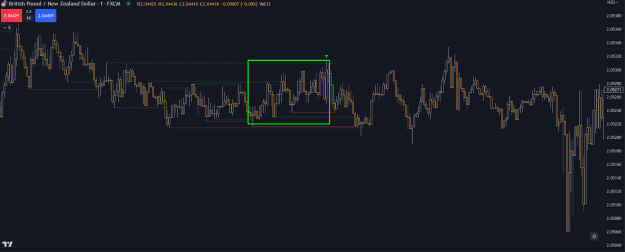
Regular Setups:
all suggestions, modifications, adjustments, and additions welcomed
"The idea is inspired by ICT (Inner Circle Trader) concepts where price is always seeking "liquidity" by reaching for trivial pivots where the average retail trader would put their stop loss. When price seeks these levels and stops out these traders, you might expect an influx of volume due to the high number of shares/contracts being exchanged. And when there is an above-average spike in volume at these prices, it's possible to assume "smart money" may be buying retail's sell stops and vice versa. This is just my interpretation - I'm aware that ICT doesn't use volume as part of his analysis, and often advocates against using volume altogether, however I personally find it to be a great analytical tool in this context."
In my opinion this works best on 1m and smaller timeframes. Volume gets very diluted on timeframes greater than 1-3 minutes. It's easier to find volume spikes on very small timeframes like the 15s.
System doesn't require any unique indicators but someone did create a free custom indicator for the system (https://www.tradingview.com/script/pxCIz9Fh-Inducement-Stop-Hunt-TFO/#:~:text=The%20idea%20is%20inspired%20by%20ICT%20%28Inner%20Circle,to%20the%20high%20number%20of%20shares%2Fcontracts%20being%20exchanged.) on TradingView
__________________________________________________________________________________________________________________
Timeframe: Any for now until we can decisively determine a superior time frame
Useful Indicators:
Pivot Points: Can help you identify structure breaks and swing points
Volume Spikes: Can help you identify when price surges for stop hunts
Swing Points, HL,LH: If you chose to not use B.O.S and just want to identify these areas for entries
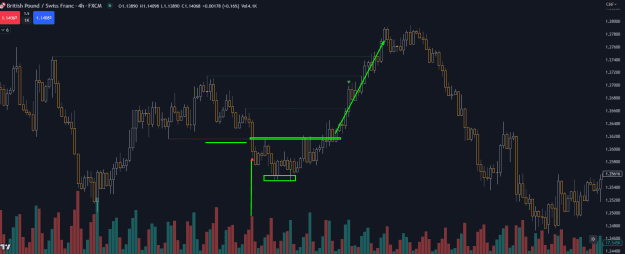
Long Entry Example:
Induce: Spike in volume, suddenly pushing price and breaking structure / or a prior swing low
Stop Hunt: Shortly after price surges, and takes out most traders stop loss, price will start to get bullish momentum
Run: Enter when a candle closes above the swing low
- stop loss is at the discretion of the trader -
Notes:
If you need help identifying which pivot,(for buy example) its the last one price closed below when it made a big volume spike
Attached Image (click to enlarge)
STOP HUNTS: Stop Hunts can present themselves differently. Sometimes, It can be one singular LONG wick that stops traders out, and sometimes price can break the swing point and consolidate a bit before making a run.
Here are some random examples to help you understand:
Wick Stop Hunt:
Attached Image (click to enlarge)
Stop Hunt that breaks Pivot and consolidates before running:
Attached Image (click to enlarge)
Regular Setups:
Attached Image (click to enlarge)
Attached Image (click to enlarge)