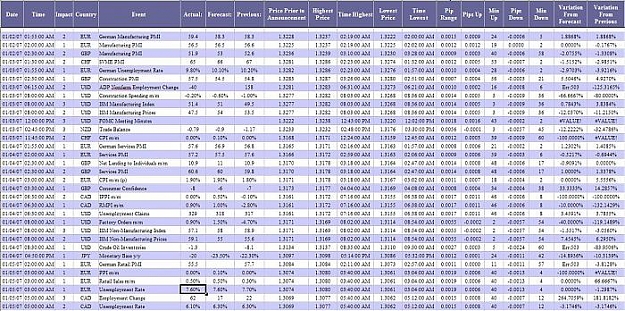
Here is a spreadsheet i made that shows how every news announcement we have had this year effected the price of the EUR/USD.... Good info for my fellow news traders that want to know where to set the stops and limits...
Price Prior to announcement = Price 1 min befor announcement (Start Price)
Highest price = highest price reached after announcement
High Time = time that highest price occoured
Lowest price = Lowest price reached after announcement
Low Time = Time that lowest price was reached
Pip Range = Highest price - Lowest price
Pips up = Highest price - start price
Min up = Mins from announcement to highest price
Pips Down = Lowest Price = Start price
Min down = Mins from announcement to Lowest price
Variation from forecast = % variation from forecast to accual (accual-forecast)/forecast
Variation from previous = % variation from prev to accual (accual-prev)/prev
---Way too big to post here is a pic. It has everything YTD. Soon I will make this sheet for all currency pairs for more in depth analysis. Shoot me an email if you wan ta copy
Attached Image (click to enlarge)
Keep it simple stoopid....