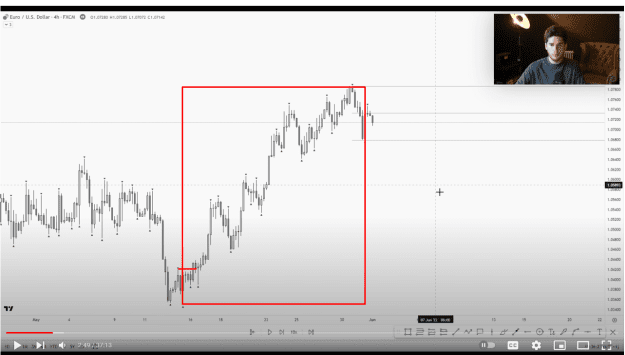
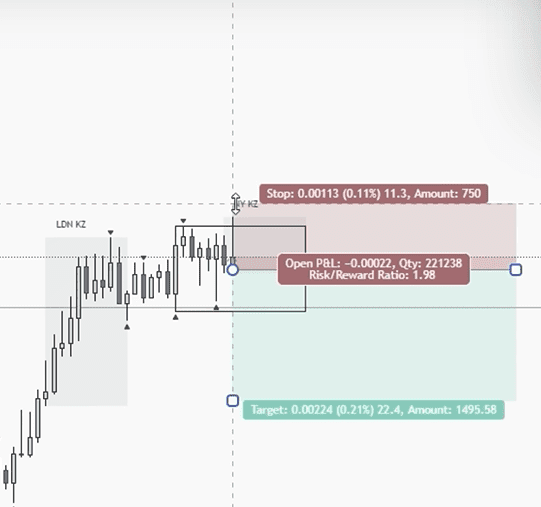
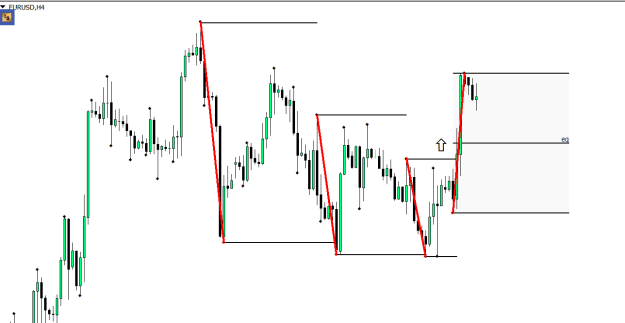
{quote} Ahh, see I was basing it on the break of the larger dealing range, with all other fractals being internal. So my break started from the large down bar. {image}
Ignored
@FireScape, this is something I would like to seek clarification too.
Based on this chart, when the external fractal was interacted, and the (black) candle closed below it, it was unconfirmed, we wait for the next candle. In the chart, the next/last candle was a green bullish candle, but it did not close above the interacted fractal, my understanding was that it was considered a FT only. Assuming the last green candle was strong and closed above the (interacted) fractal, then it would be an NFT; if it was a 2nd black candle that closed lower, it would be considered SFT.
There's some discretion there. If price breaches the low external fractal range with a close, then next candle is bullish, this is a NFT. If the the next candle is bullish but is a indecision candle, you could wait for next candle before making bias. However, anytime there's a breaching close, and then an opposite candle, that's a NFT. Price doesn't have to come to the original interaction.
{quote} Ahh, see I was basing it on the break of the larger dealing range, with all other fractals being internal. So my break started from the large down bar. {image}
Ignored
Sorry, this isn't right. The external range is the most recent fractal to be interacted with. So if you have fractals that are being printed, but not being interacted with, that's what creates that itnernal range. In your screen print, that range is far to large, thats why when Scott comes to a clean chart, hes not starting his range way down here
Attached Image (click to enlarge)
In your screen print, the most recent fractal that got interacted with is marked here. It creates a short lived NFT, and then two following bearish closes through that same fractal for SFT.
Attached Image (click to enlarge)
We do not use fractals from all the way back there like you did.
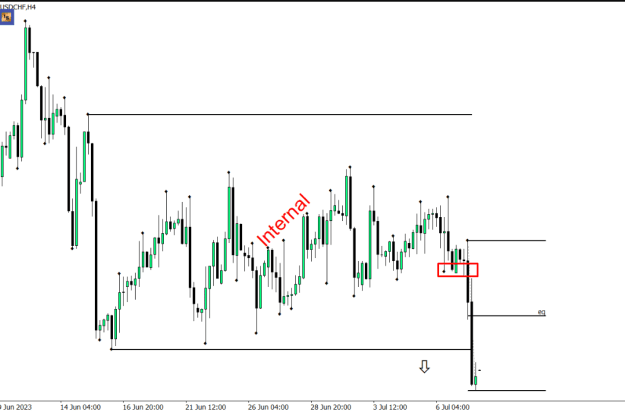
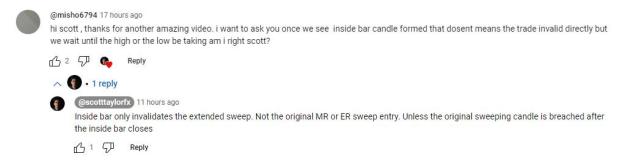
1% losses 3% wins we don't panic after a 1% loss, we're mechanical. Instead of harping on wins and losses, lets look at percent profitable. Psychologically this will keep your morale high and your emotions in check Notes - Inside Bars invalidate extended sweeps Reminder - If you cant fit your entire 1:3 RR inside of dealing range its invalid setup
Ignored
Important qualification for the Extended Sweep invalidation in the following images.
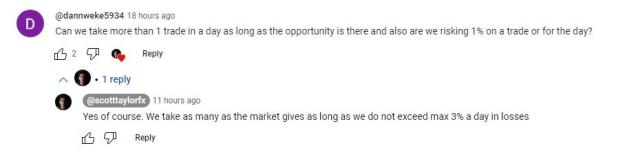
Apparently there's a maximum daily loss allowed: don't lose more than 3% in a single day. That means don't trade more than 3 losing trades within a single day, if there are no winning trades on the same day to offset the losses.
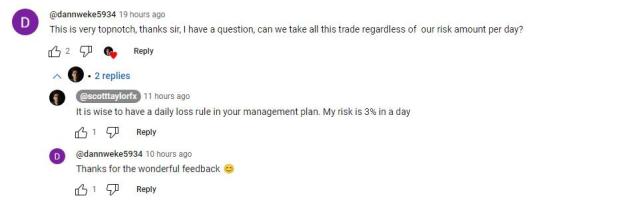
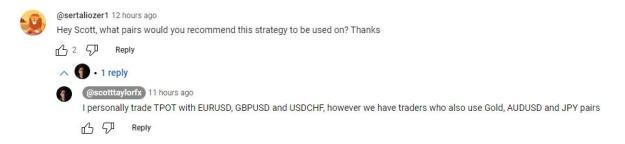
In addition to the 3 original pairs (EURUSD, GPBUSD and USDCHF), there are traders using TPOT to trade even Gold, AUDUSD and JPY pairs. Scott seems okay with this.
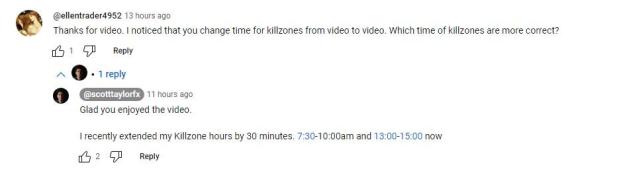
KillZones: Trading Session Indicator - Set it to just show NY and London Sessions. You can manually set the time as well: NY KillZone from 8:00 to 10:00. London KillZone is from 3:00 to 6:00.
Ignored
Worth noting that Scott recently slightly changed his London and New York kill zones. The times quoted here are British Summer Time: GMT +1.
{quote} Hi FireScape, Can you check if my understanding is correct in this drawing? Thanks. So far, this has been how I trade. I avoid counter trend trading. {image}
Ignored
Hey Haz.
Your question, specifically on what you are referring to as FT, is addressed directly and concisely by Scott in his latest video: the video that FireScape linked to yesterday. Watch carefully between 6:50 and 7:35 in that video.
Hint: Your FT is actually an NFT, and you should become bullish, not bearish.
{quote} Hey Haz. Your question, specifically on what you are referring to as FT, is addressed directly and concisely by Scott in his latest video: the video that FireScape linked to yesterday. Watch carefully between 6:50 and 7:35 in that video. Hint: Your FT is actually an NFT, and you should become bullish, not bearish. Here's the link to the video again: https://www.youtube.com/watch?v=8xV8QI3I-GQ.
Ignored
Hi Bazenga,
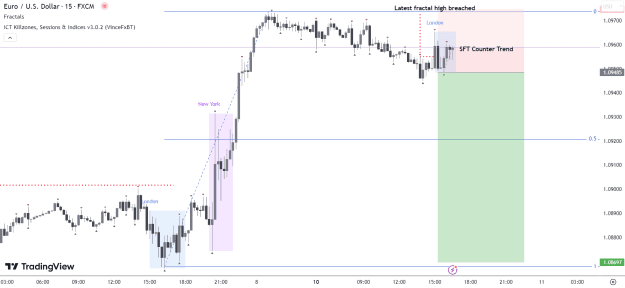
Thanks for that! Now I have a follow-up question. At around 9:25 of the video, he was selling because he was anticipating a pullback into the discount range, before buying up. But my question is, after the candle sweep of the fractal high at M15, why didn't he wait for that candle to close under the low of the candle that swept it before entering? From my observation, he immedietly entered the moment it sweeps the fractal high, and it closes under the fractal high, but the close is still higher than the low (it's the same candle, a bullish candle).
Is not waiting for the candle to close under the candle low that swept the fractal a requirement? (going bearish)
{quote} But my question is, after the candle sweep of the fractal high at M15, why didn't he wait for that candle to close under the low of the candle that swept it before entering? From my observation, he immedietly entered the moment it sweeps the fractal high, and it closes under the fractal high, but the close is still higher than the low (it's the same candle, a bullish candle). Is not waiting for the candle to close under the candle low that swept the fractal a requirement? (going bearish) {image}
Ignored
Haz, I've read and reread this question from you several times but can't seem to understand it. Scott saw a liquidity sweep to the upside, above the Equilibrium line, and that matched his criteria for a counter trend during a bullish NFT, so he took it.
I don't understand this sentence from you: "Why didn't he wait for that candle to close under the low of the candle that swept it before entering?"
That sentence seems to be implying an extra step in the analysis that I'm unaware of. What I do know is that if a liquidity sweep happens within the correct region (discount or premium), and within the killzones, you take the trade on the exact candle that swept the liquidity.
Perhaps you could further elaborate on your question?
{quote} Haz, I've read and reread this question from you several times but can't seem to understand it. Scott saw a liquidity sweep to the upside, above the Equilibrium line, and that matched his criteria for a counter trend during a bullish NFT, so he took it. I don't understand this sentence from you: "Why didn't he wait for that candle to close under the low of the candle that swept it before entering?" That sentence seems to be implying an extra step in the analysis that I'm unaware of. What I do know is that if a liquidity sweep happens within...
Ignored
Hi Bazenga, sorry I think I got it mixed up. But it's clear to me now after rewatching that part of the video for the nth time. I appreciate your help thanks.
Now I have another question regarding how to draw the H4 range (and the M15 range). I am under the impression to just use the latest high and low fractals. But Scott's latest video, and the discussion of external and internal ranges just has me confused.
{quote} Hi Bazenga, sorry I think I got it mixed up. But it's clear to me now after rewatching that part of the video for the nth time. I appreciate your help thanks. Now I have another question regarding how to draw the H4 range (and the M15 range). I am under the impression to just use the latest high and low fractals. But Scott's latest video, and the discussion of external and internal ranges just has me confused.
Ignored
Yes this is a question I've seen several people get confused about. In order to see what is the best way of drawing the ranges, think logically about how those ranges advance in time. You'll note that the ranges don't shift unless they are breached. This is a very important thing, because it means that if price makes a very huge move in one direction, and ends up having a very huge range, and then subsequently it creates a lot of internal fractals within that huge range, those internal fractals will NOT be considered at all. You will only think about evaluating the range if the external fractals are breached.
This logically means that if you come to a fresh chart, where the ranges haven't yet been drawn, you can't automatically assume that the current range is the most recent fractals. Rather, you have to look backwards at the price, and see how it has moved: which side has had fractals get breached recently. If for example there's an uptrend, then it's likely that the top fractals have been breached over and over again, and each time they get breached, the range is extended to the high of the most recent candle, and the bottom fractal is also moved to the most recent one that got set up BEFORE that recent high. The opposite goes for a downtrend.
If the price is ranging, then it's likely that the most recent fractals are inside an external range created further back in time. You should check for this, and ignore those recent fractals if they haven't breached that external range from the past.
{quote} Sorry, this isn't right. The external range is the most recent fractal to be interacted with. So if you have fractals that are being printed, but not being interacted with, that's what creates that itnernal range. In your screen print, that range is far to large, thats why when Scott comes to a clean chart, hes not starting his range way down here {image} In your screen print, the most recent fractal that got interacted with is marked here. It creates a short lived NFT, and then two following bearish closes through that same fractal for...
Ignored
I think I have to respectfully disagree with that mate.
The large red box you drew isnt a dealing range on H4 at all, because we kept breaking fractal highs, I agree with you on that, hence the reason I havent drawn it like that myself, not sure why it was used as an example.
If you go to 2.53 he says we dont mark any internal range fractals..
Otherwise his dealing range would have been tiny.
So based on that, my interpretation is...we only mark off new fractal highs/lows that have interacted with the previous dealing range highs/lows. And any internal interactions are ignored because they arent part of a dealing range. I agree with Bazenga on this.
An original dealing range no matter how big or small stays locked in until one of its boundaries are interacted with, that could take hours, days..or 3 weeks as seen on my chart. Ive not heard him mention time decay as having an impact on the validity of dealing ranges.
Might be a case of agree to disagree, maybe it will be clarified in time though.
Or maybe one of his mentorship students can clarify
Edit: Ive sent him a link to the screenshot in his youtube comments so hopefully he can clarify
{quote} Yes this is a question I've seen several people get confused about. In order to see what is the best way of drawing the ranges, think logically about how those ranges advance in time. You'll note that the ranges don't shift unless they are breached. This is a very important thing, because it means that if price makes a very huge move in one direction, and ends up having a very huge range, and then subsequently it creates a lot of internal fractals within that huge range, those internal fractals will NOT be considered at all. You will only...
Ignored
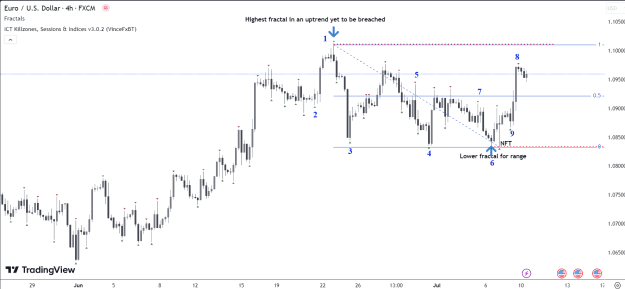
Again, thank you so much. This is the current EU chart on H4. Is that correctly drawn? Red dotted line is the range.
{quote} Again, thank you so much. This is the current EU chart on H4. Is that correctly drawn? Red dotted line is the range. {image}
Ignored
No, that wouldn't be the correct range. I will explain the thinking process that one uses to correctly establish the current ranges.
First examine the image below. It is the image you had posted, but I have added some numbers on it to make my explanations easier to follow.
So here's what you do:
You first note the highest fractal within your image. In this case, that fractal is the one labelled 1. Since the price hasn't breached this fractal, and price has been in an uptrend up to that fractal, it becomes our initial reference point.
You then trail the price backwards, and take note of the nearest bottom fractal behind fractal 1. This bottom fractal is number 2 in the image below. That becomes your initial bottom fractal, and together with fractal 1, they form your initial range.
Now extend this initial trading range forwards in time, until it becomes breached. You'll find it becomes breached to the lower side, as eventually fractal 3 forms. Extend your range up to this fractal, and trail price backwards to check if any new top fractal has formed. No such fractal has formed, so your top fractal is still fractal 1. So your current range is now between fractal 1 and fractal 3.
Moving forwards, you'll note that 6 other internal fractals form without the current range being breached. In a real time trading session, all these fractals would be ignored. The next time the range is breached, is to the downside once again, and eventually fractal 4 is formed. You then move the bottom range to that level (4), then trail price backwards, looking for new top fractals. Several such fractals have formed, and you shift the top range to the nearest such, which is fractal number 5 in the image below.
Moving forwards again, you note that another 4 internal fractals form, but it is only at the fractal I've labelled as 6 that the bottom range gets breached again. So those 4 internal fractals get ignored, and you only move the range at that fractal 6. Then you trail price backwards to the most recent top fractal, and move the top range there. That fractal is number 7 in the image below. So the current range is now between fractal 7 (to the top) and fractal 6 (to the bottom).
Letting price move forwards again, you ignore all new fractals until price is breached again. This eventually happens to the topside, when fractal 7 is breached, to eventually form fractal 8. Ypu'll note there was a top fractal that had formed just below the level of 7, but since it was within the existing range then, it was ignored. So the current top range now moves to fractal 8, and trailing price backwards, you move the bottom fractal from position 6 to 9, since that's the nearest bottom fractal now.
This then becomes your current trading range: between fractal 8 (to the top), and fractal 9 (to the bottom).
If you reread this procedure several times, while double checking the image, I think you'll eventually get the hang of it. It's an easy process once you get used to it, and you can actually just follow the price with your eyes and quickly determine the current trading range, with practice.