Hi Alan, i am back from working away and want to get back into trading with your system. I too struggle with the ABCD getting them correct. Would appreciate any help just to simply show us how to draw them out correctly. I tried last time but think i drew them wrong.
The Indi does an excellent job of painting the ABCD for you but it seems to me:
The C point is the candle close over the EMA.
The A point has a lower close than C (in the case of sell ABCD) which also creates RSI divergence with the C point.
And the B point is the highest close between A and C (for a Sell ABCD).
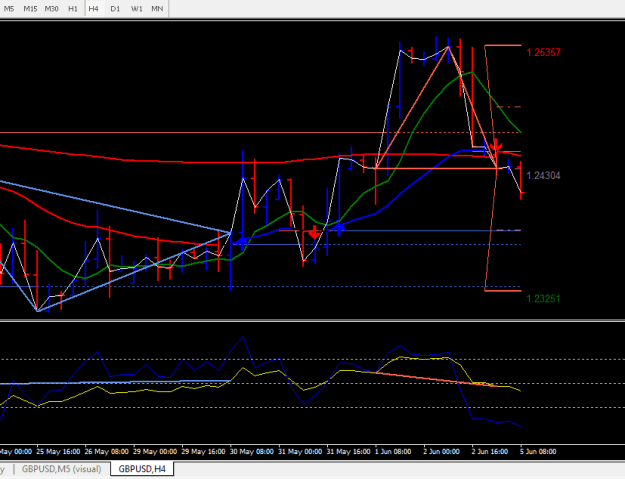
Just looking over some previous H4 ABCD results with Nalas idea of a reverse pending trade at the 50% level and TP at the D to catch the bad ones. Doesnt look too sad so far.
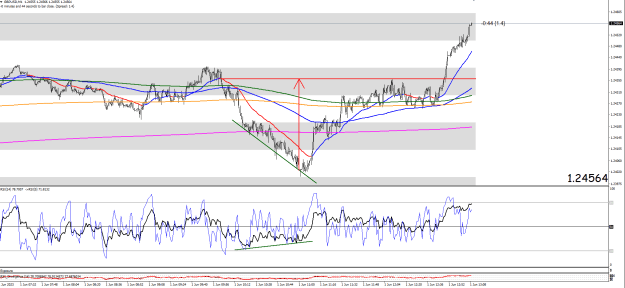
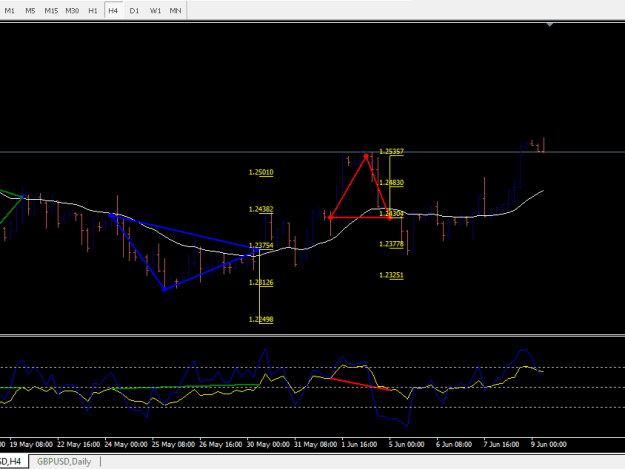
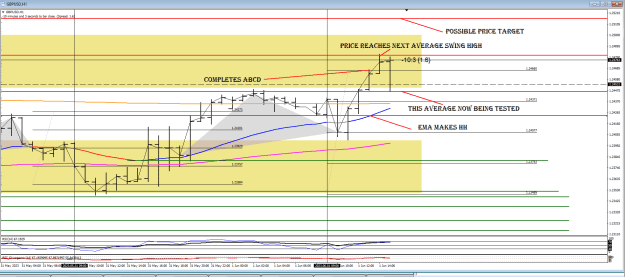
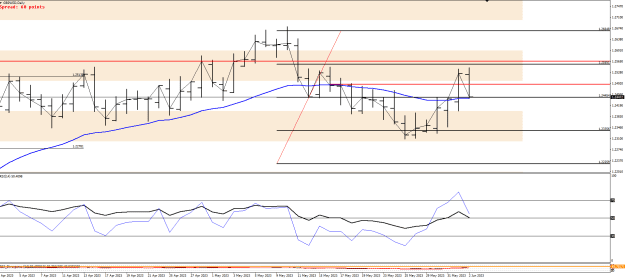
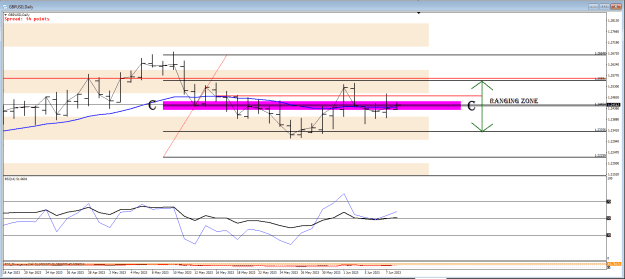
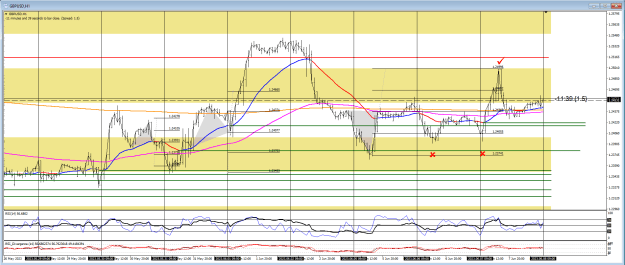
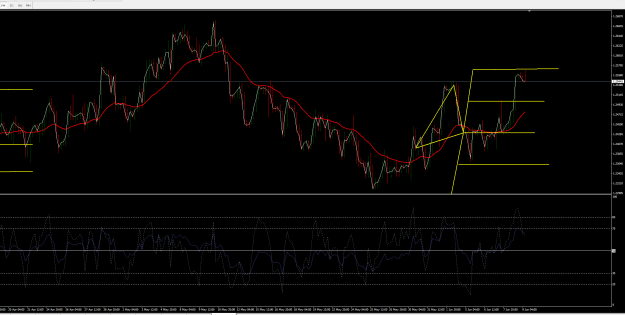
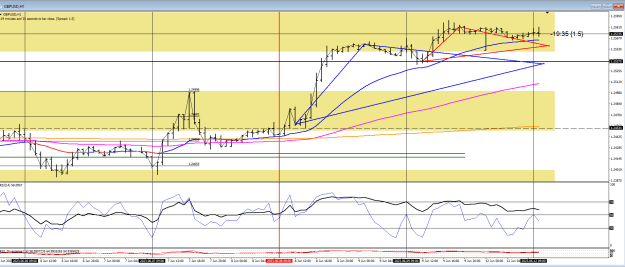
For Monday we need to be careful. The daily failed the 50% of D and is now sitting exactly on C again. {image} Is it going to bounce or cross? Well, this would be pure guesswork, so I am on the fence with this until I get a signal to the contrary. The one-hour chart is also a bit ambiguous. {image} I need to sit on my hands to warm them up anyway. The story should unfold as we approach the London open.
Ignored
That price is definitely glued to that Daily C Point.
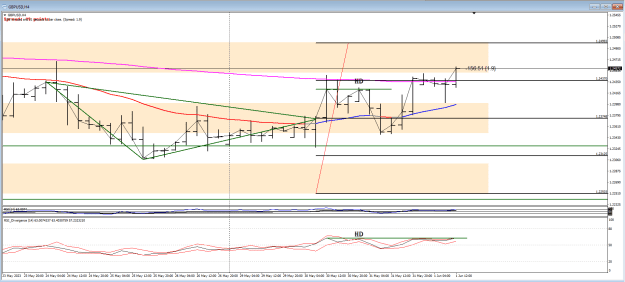
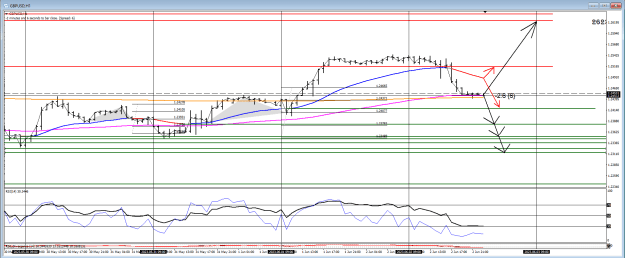
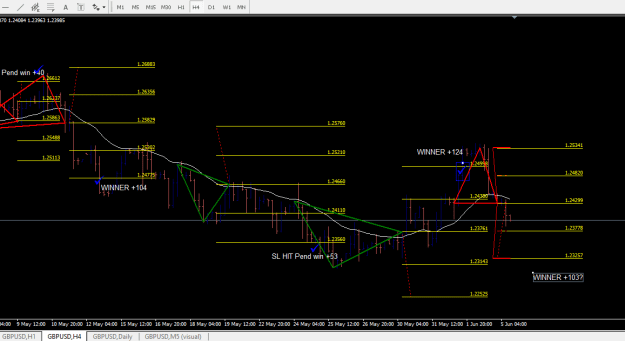
Seems the price respected the ABCD I posted on post 9087 on the 4H timeframe. Earlier price had hit the 50% before retracing to C then started going up and just got to almost hitting the D.{edit: I hope the plotting is correct as per Alan's teaching}
Seems the price respected the ABCD I posted on post 9087 on the 4H timeframe. Earlier price had hit the 50% before retracing to C then started going up and just got to almost hitting the D.{edit: I hope the plotting is correct as per Alan's teaching} {image}
Ignored
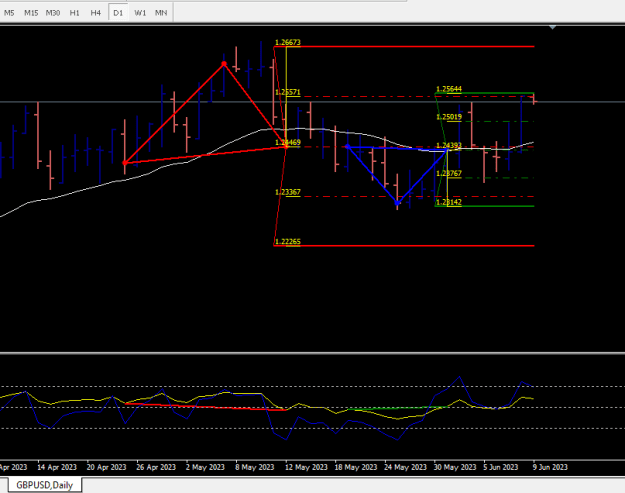
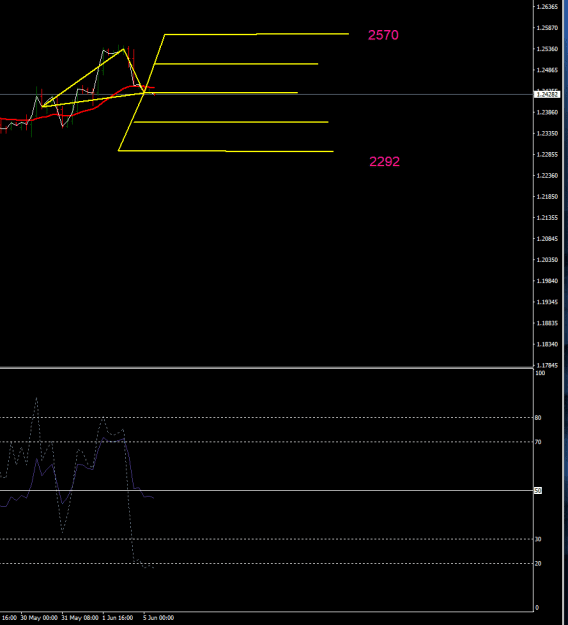
heres mine. H4 buy ABCD is hit and there is another buy ABCD on the daily almost near target.
Seems to be ranging between the 50% on another daily ABCD.