LTCUSD Analysis: Inverted Hammer Pattern above $79.64

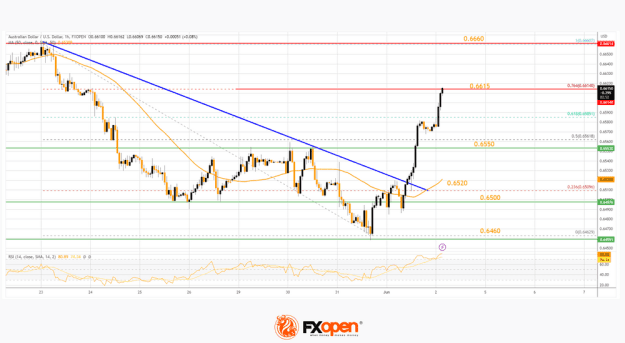
Bulls were able to take control of the market last week, and after touching a low of $79.64 on 13 May, the price started to correct higher against the US Dollar, crossing the $94.00 handle today in the European trading session.
The short-term outlook for Litecoin has turned mildly bullish.
On the H1 timeframe: 
VIEW FULL ANALYSIS VISIT - FXOpen Blog...
Disclaimer: This Forecast represents FXOpen Companies opinion only, it should not be construed as an offer, invitation or recommendation in respect to FXOpen Companies products and services or as Financial Advice.
Attached Image (click to enlarge)
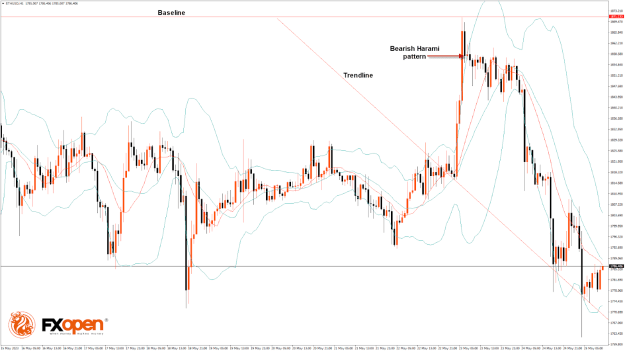
Bulls were able to take control of the market last week, and after touching a low of $79.64 on 13 May, the price started to correct higher against the US Dollar, crossing the $94.00 handle today in the European trading session.
The short-term outlook for Litecoin has turned mildly bullish.
On the H1 timeframe:
- There is an inverted hammer pattern above the $79.64 handle. It signifies the end of a bearish phase and the start of a bullish phase in the market.
- Litecoin price is trading above its 100-hour simple moving average and 200-hour exponential moving average and just above its pivot level of $92.97.
- The relative strength index is at 69.02, indicating a strong demand for Litecoin and a shift towards the bullish phase in the markets.
- Litecoin remains above most of the moving averages, which is a bullish signal at current market levels of $93.20.
- Some of the technical indicators are bullish.
- The average true range indicates low market volatility.
Attached Image (click to enlarge)
VIEW FULL ANALYSIS VISIT - FXOpen Blog...
Disclaimer: This Forecast represents FXOpen Companies opinion only, it should not be construed as an offer, invitation or recommendation in respect to FXOpen Companies products and services or as Financial Advice.
FXOpen - International True ECN Broker