{quote} So, EMA makes LL and price makes the next level to make an RSI bull div.....Cool It all gets to be so easy when you know how hey.
Ignored
Thanks to your method, Master. Can you give some example about Two-bar test with candles. Your previous examples were bars so I can't imagine how it looks like
{quote} Thanks to your method, Master. Can you give some example about Two-bar test with candles. Your previous examples were bars so I can't imagine how it looks like
Ignored
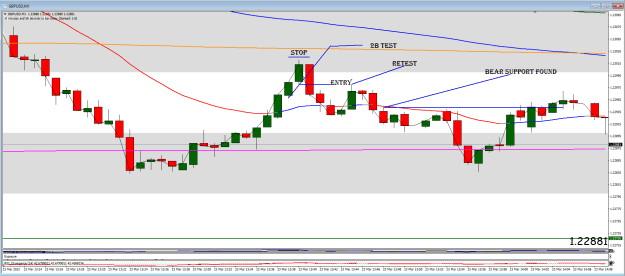
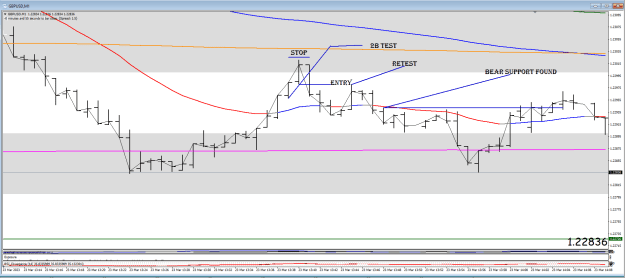
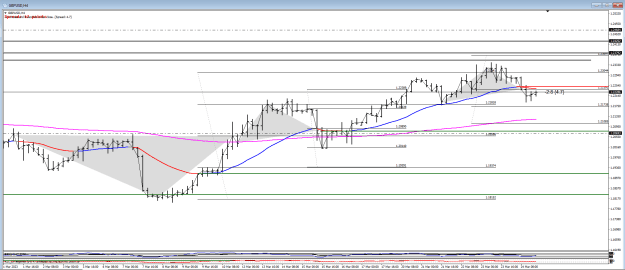
I fail to see what the fascination with candles is all about.
Attached Image (click to enlarge)
To me using bars is far better. Below is exactly the same chart shot.
{quote} I fail to see what the fascination with candles is all about. {image} To me using bars is far better. Below is exactly the same chart shot. {image}
Ignored
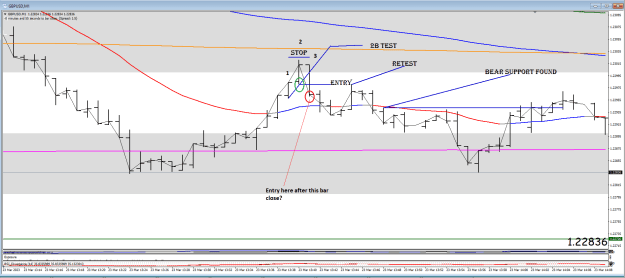
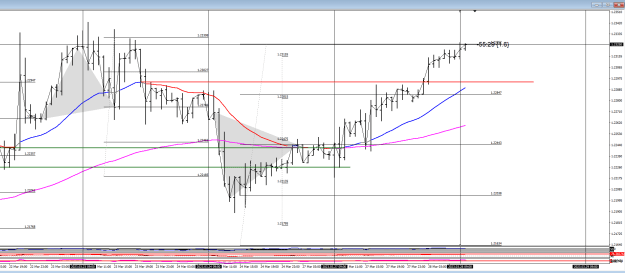
Master, need your help with TBT.
As my understanding, the entry should be at the close of the third bar (No.3) if it close below the mini trendline, right?
{quote} Master, need your help with TBT. As my understanding, the entry should be at the close of the third bar (No.3) if it close below the mini trendline, right?{image}
Ignored
This was not an actual trade I was just showing how to use the TBT.
Now as for the entry. I have it as a pending order and slide it up to the position I indicated. This is of course I see a trade in the offing.
Having the price to back to pick up the order is better than simply jumping in, at least we then know the direction has change even if we don't know for how long. If things start to pick up in our favour we can always add to the position.
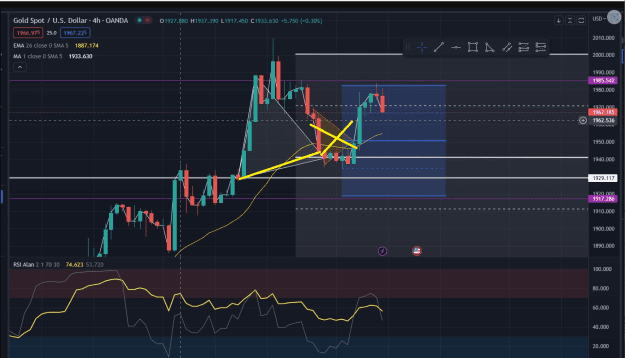
Long time to come back this thread, still read one by one! I check for H4, it's form a ABC right Mr. Alan? D1 price over EMA26 so we will looking in smaller time frame to find Div. to Long. {image}
Ignored
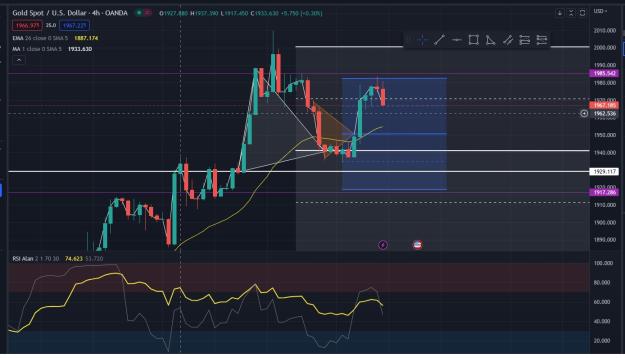
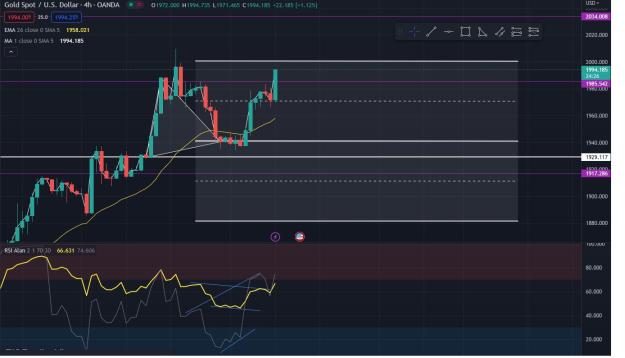
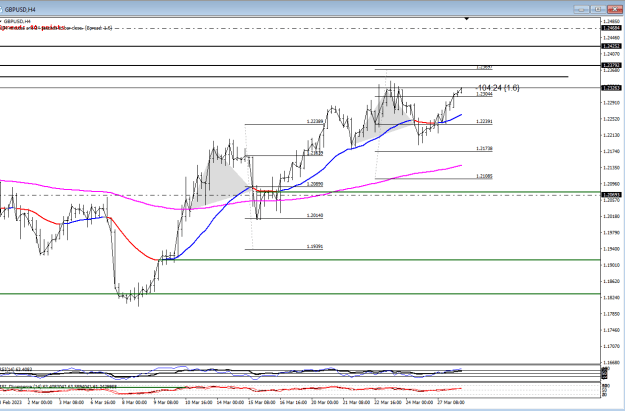
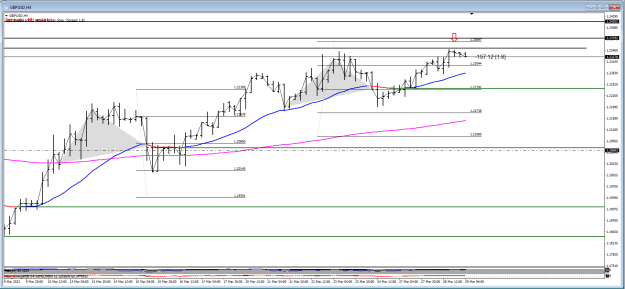
I don't know why your ABC triangle is so big.
My 4 hour looks like below. As we can see the previous two triangles have hit their targets and we are working on this third one now.
{quote} I don't know why your ABC triangle is so big. My 4 hour looks like below. As we can see the previous two triangles have hit their targets and we are working on this third one now. {image}
Ignored
I made a mistake on the chart above. That large triangle on the left does not exist. I was trying to see if there was a triangle on the daily and forgot to remove it.
{quote} I made a mistake on the chart above. That large triangle on the left does not exist. I was trying to see if there was a triangle on the daily and forgot to remove it. Nobody seems to have noticed.
Ignored
Thanks so much for your correct, the reason i draw a big triangle because from the point B the price not yet cross to ema26.
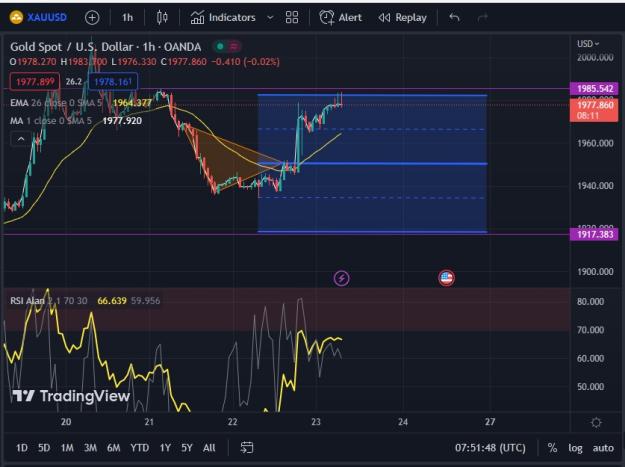
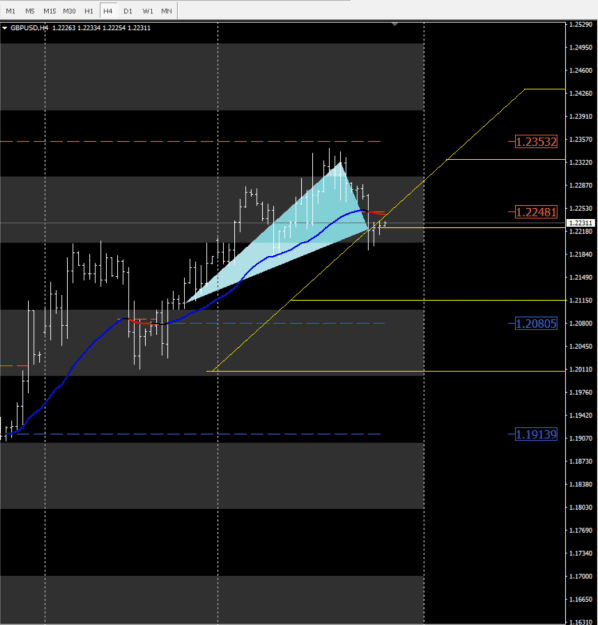
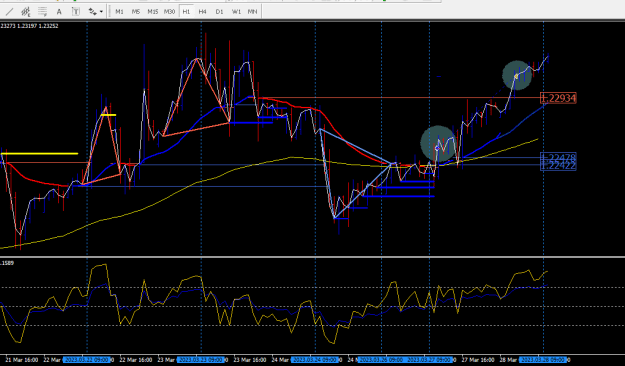
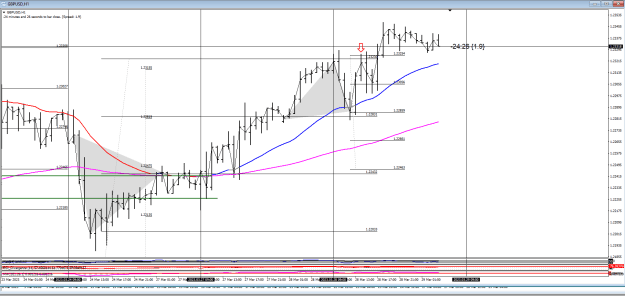
The lastest 1 hour ABC has just hit its target D. That makes 12 targets hit in the last 27 days making them quite common every couple of days or so. {image}
We haven't seen a quickie like yesterdays for some time and guess what... it was 40 pips.
Notice I am now using my Quartile tool to measure the distances. Very simple to use and gives me the actual prices to target. It also keeps the clutter off my charts.