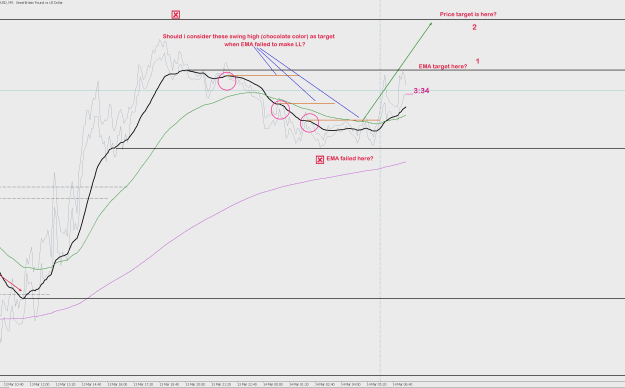
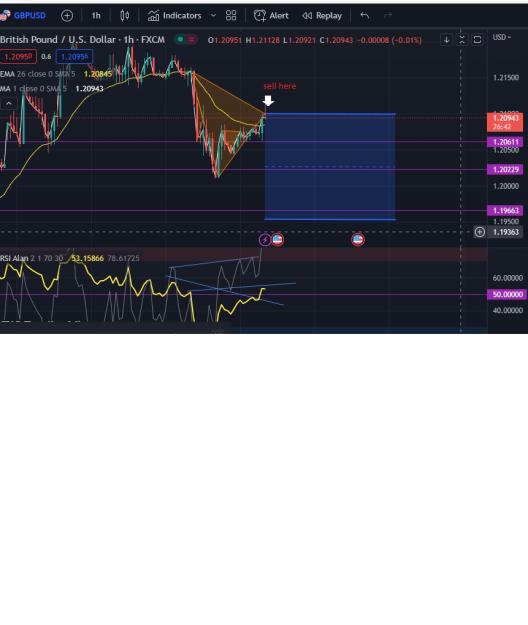
Hey Alan, I wanna ask, in the situation like this, even though the H1 are at the zoo point, M5 price stuck between the two swing, what is the indicator to enter the trade? will it be the price break the two level or the price make a swing high/low accordingly?
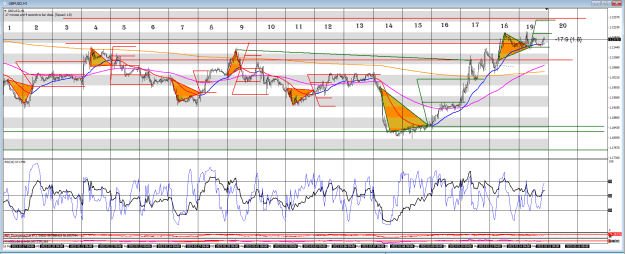
Hey Alan, I wanna ask, in the situation like this, even though the H1 are at the zoo point, M5 price stuck between the two swing, what is the indicator to enter the trade? will it be the price break the two level or the price make a swing high/low accordingly? {image}
Ignored
In situations like this where the EMA has failed to make the LL and then gone on to fail the HH I regard it as ranging and we need a break one way or the other.
It doesn't mean that we cannot trade the range if we just follow the signals even if the prizes are small we can still make our percentages. This is because percentages are relative in that the smaller the targets the larger our lot size.
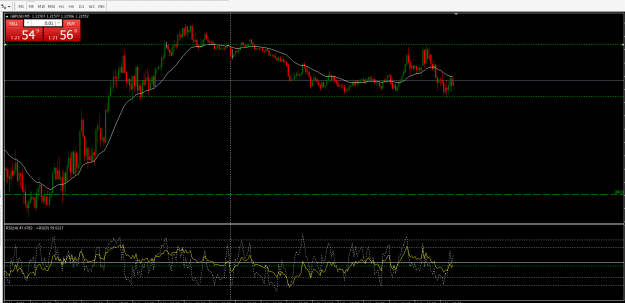
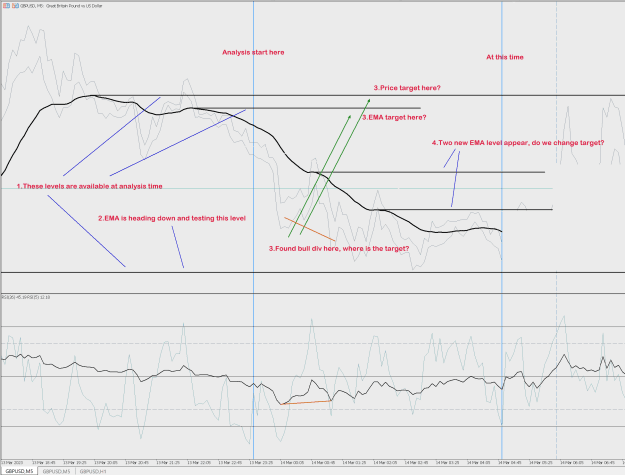
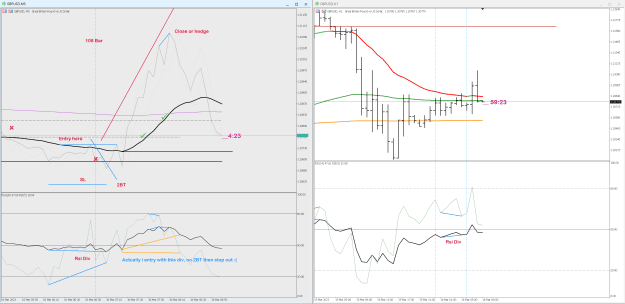
{quote} Here you go I have marked your chart {image} I don't see any indicator to show you divergence.
Ignored
Thank for your help.
I remove RSI from this chart to get the feel of the EMA swings. I am using RSI on another M5 chart.
Honestly I stuck here with EMA swing Trying to make more clear questions.
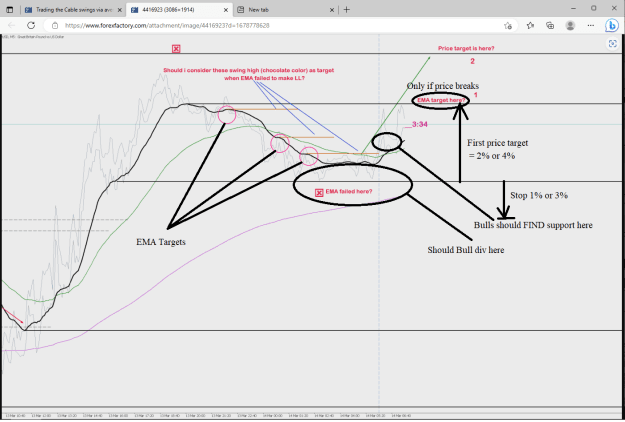
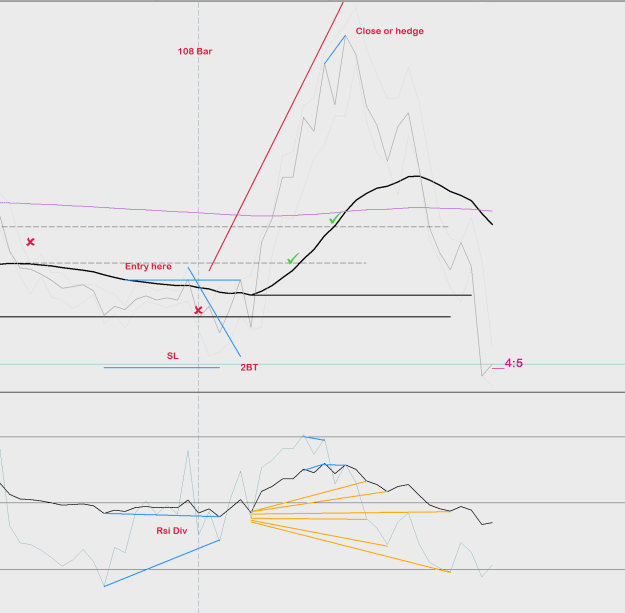
{quote} Master Alan, please help me with these process. Am I correct? {image}
Ignored
1) Don't use the high and low for the price bars. Just use a normal price bar.
2) Put a 1 period SMA on the chart. This will much more clearly show the DIV's.
Your bull divergence should return the price to the EMA (that would be the target) If it fails then price will make a LL, If it makes it and crosses the EMA and FINDs support then it will test the EMA swing highs.
{quote} 1) Don't use the high and low for the price bars. Just use a normal price bar. 2) Put a 1 period SMA on the chart. This will much more clearly show the DIV's. Your bull divergence should return the price to the EMA (that would be the target) If it fails then price will make a LL, If it makes it and crosses the EMA and FINDs support then it will test the EMA swing highs.
Ignored
Thank you for teaching, master.
Hope you don't mind me asking too much
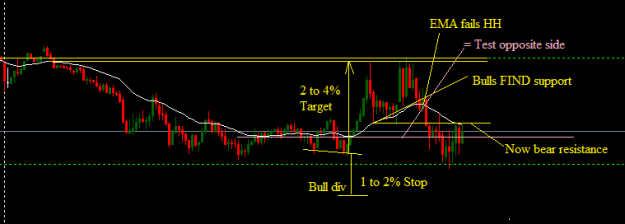
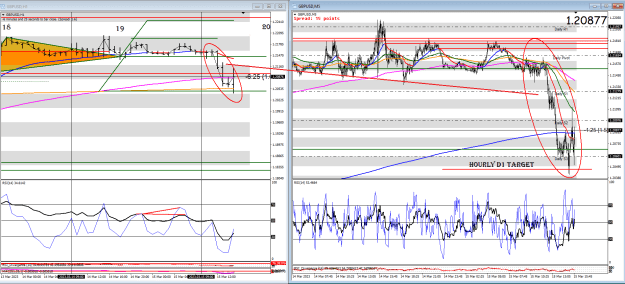
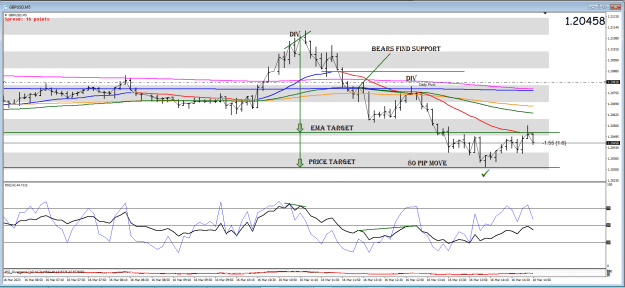
I miss the H1 bullish div and blindly jump in. Blue text is live trade (terrible one).
My hindsight trade is in red text, correct me please.
- Take inference from H1 bullish div, M5 bullish div.
Attached Image (click to enlarge)
Question is, if we missed the H1 inference then what should we do, (Wait ?)
How to avoid the failed div (orange div)?
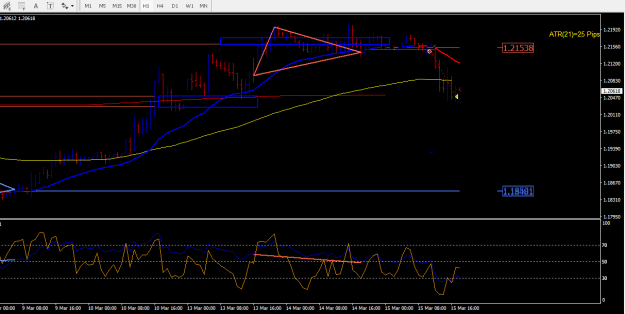
I miss the H1 bullish div and blindly jump in. Blue text is live trade (terrible one). My hindsight trade is in red text, correct me please. - Take inference from H1 bullish div, M5 bullish div. {image} Question is, if we missed the H1 inference then what should we do, (Wait ?) How to avoid the failed div (orange div)? {image} Thank you so much.
Ignored
I am having a hard time trying to make any sense from your charting,