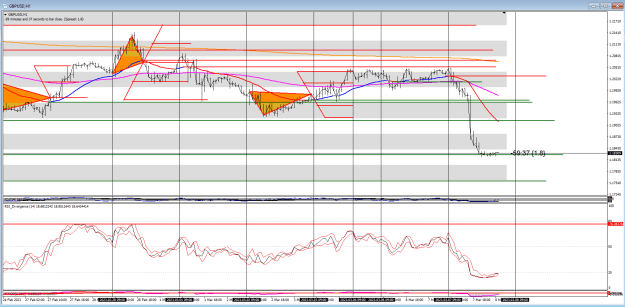
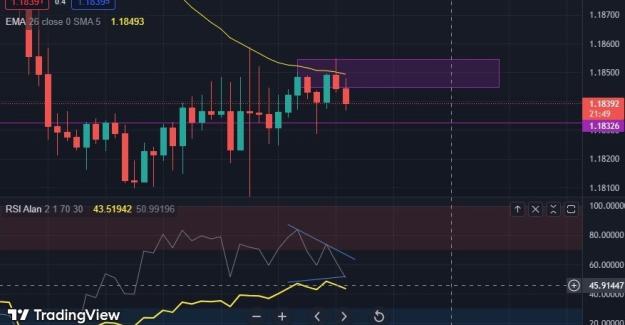
Disliked{quote} Here on the 5 min chart I have drawn todays ABCD for you. Look how A and C are in divergence. C is lower than A on the price chart but on the RSI C is higher than A. On the price chart A is on the southern side of the EMA and C is on the northern side of the same EMA so we can construct the triangle ABC, The target price is the distance from A to B starting from C. C is always the first close across the EMA. Now we need to look at the signals within and we see a nice HD to go long on. The entry is the HD, the target is D and the stop is...Ignored