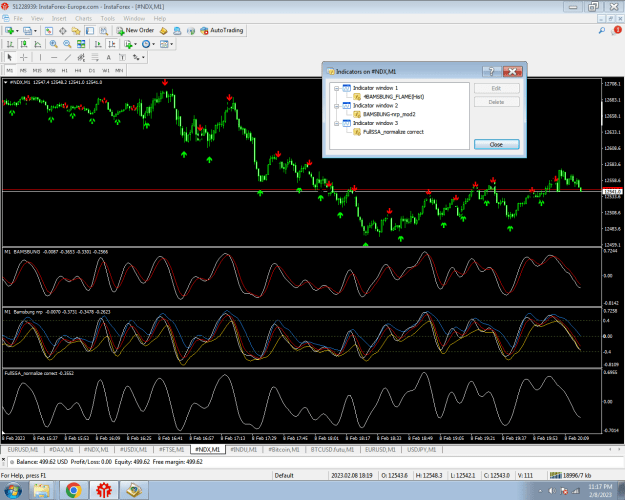
Hello JeanLouie, please is it possible to make this indicator non repaint after candle close. Thanks in advance. {file}Note: I wasn't able to attach the DLL.
A minor operation to the so called 4bamsbung toy -
lurking around since long with decompiled face
somebody renamed it (for some hidden agenda) from "ssa" (singular spectrum analysis) - the old code
the additional red line added for to producing signals when crossing,an poor coding example though
SSA is an recalculating/repainting indicator it self
there are plenty of different names and variations of it "Bamsbung Finnal V2" "BAMSBUNG_dll" "BAMSBUNG-NO REPAINT-3" "BAMSBUNG-nrp_mod2" even more too,all same with a minor difference
all these and SSA needs a dll file for to work/display
better to avoid it especially in signaling mode
PS : as far as it concerns what the poster asked,if this including all other recalculating/repainter indicators when coded the way not to repaint then their signals and display almost changed to what that you do not like at all,at least i believes like this
Hey guys. Im looking for an EA for MT5 on the forums to close any new opened trade for any currency after specific amount of time (For example 5 minutes or 10 minutes, and not on a specific clock time) but I can't, I found codes but I tried to create the ea and I get a lot of errors. Any help will be appreciated.
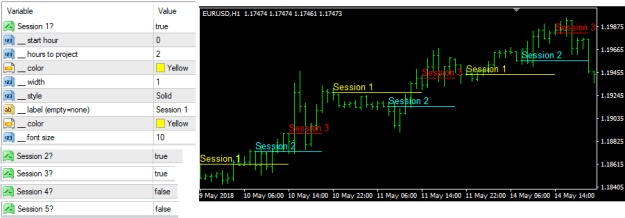
Session_Open_Lines
- prints open lines for up to 5 sessions
- start hours for each
- durations for each
- label option for each
- style n color options too
Requested Session_Open_Lines - prints open lines for up to 5 sessions - start hours for each - durations for each - label option for each - style n color options too v1.01 - start time includes minutes {image} {file}
Ignored
you solve this request beautifully.
I always use this one session indicator, but it has a fault, somehow it can not display the session in TF M1. If you have some spare times could you pleas correct it. Secondly the auto setting is causing wrong display of the sessions, but if it is too time-demanding to fix it, it is fine I can use it in manual mode
The attached MT5 MACD indicator is freely available on the internet. I need an alert on the red trigger line only, when it reaches a certain predetermined level. Currently the indi has a crossing alert, which is not that important to me.
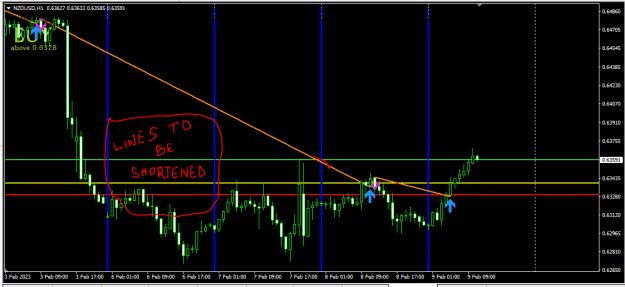
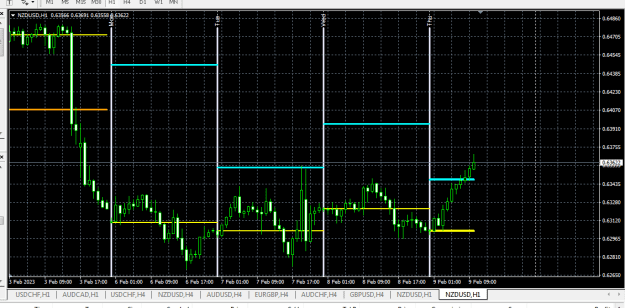
Hello Shab please i need a little modif for this indicator just to cut the horizontal lines to look just like in the 2nd screen shot can it be done so that the lines will be limited to appear only for the space of 24hrs daily?Thanks
#property indicator_chart_window

extern int BarsBack = 1000;


input string          InpNameUp="GapUp"; // Line name
input string          InpNameDown="GapDown"; // Line name
input color           InpColor=clrRed;     // Line color
input color           InpColor1=clrBlue;     // Line color
input ENUM_LINE_STYLE InpStyle=STYLE_SOLID; // Line style
input int             InpWidth=1;          // Line width
input bool            InpBack=false;       // Background line
input bool            InpSelection=false;   // Highlight to move
input bool            InpRayRight=false;   // Line's continuation to the right
input bool            InpHidden=false;      // Hidden in the object list
input long            InpZOrder=0;         // Priority for mouse click

double Poin;

//+------------------------------------------------------------------+
//| Custom indicator initialization function                         |
//+------------------------------------------------------------------+
int init()
{
Poin = Point;
//Checking for unconvetional Point digits number
   if ((Point == 0.00001) || (Point == 0.001)) Poin *= 10;

   return(0);
}

//+------------------------------------------------------------------+
//| Custom indicator deinitialization function                       |
//+------------------------------------------------------------------+
int deinit()
{
   for (int i = 0; i < Bars; i++)
   {
      ObjectDelete("TrendlineUp" + i);
      ObjectDelete("TrendlineDown" + i);
   }
   return(0);
}

//+------------------------------------------------------------------+
//| Custom indicator iteration function                              |
//+------------------------------------------------------------------+
int start()
{

   int counted_bars = IndicatorCounted();
   if (counted_bars > 0) counted_bars--;
   int limit = Bars - counted_bars;
   if (limit > BarsBack) limit = BarsBack;
   //Comment(BarsBack);

   for (int i = 0; i <= limit; i++)
   {
      //GapDown
      if(High[i+1] < Low[i+3])
      {
         int j=4;
         while(Low[i+4] < Low[i+3] && Low[i+4] > High[i+1])
         {
             if(!GapDownCreate(i+j, 0,InpNameUp,0,Time[i+j],Low[i+j],Time[0],Low[i+j],InpColor,InpStyle,InpWidth,InpBack,InpSelection,InpRayRight,InpHidden,InpZOrder))
             {
               return(0);
             }
             j = j++;
         }
      }
      //TimeCurrent() + 10 * 365 * 24 * 60 * 60, HighCandle_1, i, clrRed);

      //GapUp
      if(Low[i+1] > High[i+3])
      {
         int k=4;
         while(High[i+4] > High[i+3] && High[i+4] < Low[i+1])
         {
             if(!GapUpCreate(i+k, 0,InpNameDown,0,Time[i+k],Low[i+k],Time[0],Low[i+k],InpColor1,InpStyle,InpWidth,InpBack,InpSelection,InpRayRight,InpHidden,InpZOrder))
             {
               return(0);
             }
             k = k++;
         }
      }
      //TimeCurrent() + 10 * 365 * 24 * 60 * 60, HighCandle_1, i, clrRed);
   }
   return (0);
}

//+------------------------------------------------------------------+
//| Create a line by the given coordinates                     |
//+------------------------------------------------------------------+
bool GapUpCreate(const int j,
                 const long            chart_ID=0,        // chart's ID
                 const string          name="GapUp",  // line name
                 const int             sub_window=0,      // subwindow index
                 datetime              time1=0,           // first point time
                 double                price1=0,          // first point price
                 datetime              time2=0,           // second point time
                 double                price2=0,          // second point price
                 const color           clr=clrBlue,        // line color
                 const ENUM_LINE_STYLE style=STYLE_SOLID, // line style
                 const int             width=1,           // line width
                 const bool            back=false,        // in the background
                 const bool            selection=false,    // highlight to move
                 const bool            ray_right=false,   // line's continuation to the right
                 const bool            hidden=false,       // hidden in the object list
                 const long            z_order=0)         // priority for mouse click
  {

   ResetLastError();

   if(!ObjectCreate(chart_ID,name+j,OBJ_TREND,sub_window,time1,price1,time2,price2))
     {
      Print(__FUNCTION__,
            ": failed to create a trend line! Error code = ",GetLastError());
      return(false);
     }
   ObjectSetInteger(chart_ID,name+j,OBJPROP_COLOR,clr);
   ObjectSetInteger(chart_ID,name+j,OBJPROP_STYLE,style);
   ObjectSetInteger(chart_ID,name+j,OBJPROP_WIDTH,width);
   ObjectSetInteger(chart_ID,name+j,OBJPROP_BACK,back);
   ObjectSetInteger(chart_ID,name+j,OBJPROP_SELECTABLE,selection);
   ObjectSetInteger(chart_ID,name+j,OBJPROP_SELECTED,selection);
   ObjectSetInteger(chart_ID,name+j,OBJPROP_RAY_RIGHT,ray_right);
   ObjectSetInteger(chart_ID,name+j,OBJPROP_HIDDEN,hidden);
   ObjectSetInteger(chart_ID,name+j,OBJPROP_ZORDER,z_order);
   return(true);
  }

//+------------------------------------------------------------------+
//| Create another line by the given coordinates                     |
//+------------------------------------------------------------------+
bool GapDownCreate(const int k,
                 const long            chart_ID=0,        // chart's ID
                 const string          name="GapDown",  // line name
                 const int             sub_window=0,      // subwindow index
                 datetime              time1=0,           // first point time
                 double                price1=0,          // first point price
                 datetime              time2=0,           // second point time
                 double                price2=0,          // second point price
                 const color           clr=clrRed,        // line color
                 const ENUM_LINE_STYLE style=STYLE_SOLID, // line style
                 const int             width=1,           // line width
                 const bool            back=false,        // in the background
                 const bool            selection=false,    // highlight to move
                 const bool            ray_right=false,   // line's continuation to the right
                 const bool            hidden=false,       // hidden in the object list
                 const long            z_order=0)         // priority for mouse click
  {

   ResetLastError();

   if(!ObjectCreate(chart_ID,name+k,OBJ_TREND,sub_window,time1,price1,time2,price2))
     {
      Print(__FUNCTION__,
            ": failed to create a trend line! Error code = ",GetLastError());
      return(false);
     }
   ObjectSetInteger(chart_ID,name+k,OBJPROP_COLOR,clr);
   ObjectSetInteger(chart_ID,name+k,OBJPROP_STYLE,style);
   ObjectSetInteger(chart_ID,name+k,OBJPROP_WIDTH,width);
   ObjectSetInteger(chart_ID,name+k,OBJPROP_BACK,back);
   ObjectSetInteger(chart_ID,name+k,OBJPROP_SELECTABLE,selection);
   ObjectSetInteger(chart_ID,name+k,OBJPROP_SELECTED,selection);
   ObjectSetInteger(chart_ID,name+k,OBJPROP_RAY_RIGHT,ray_right);
   ObjectSetInteger(chart_ID,name+k,OBJPROP_HIDDEN,hidden);
   ObjectSetInteger(chart_ID,name+k,OBJPROP_ZORDER,z_order);
   return(true);
  }
Hi every one,
Have a nice trading week.
I need an EA base on stochastic that I can use it for crude oil MTF, especially H1 and H4.
Thanks for your help in advance and appreciate it.
Requested Session_Open_Lines - prints open lines for up to 5 sessions - start hours for each - durations for each - label option for each - style n color options too v1.01 - start time includes minutes {image} {file}
{quote} Hello Shab please i need a little modif for this indicator just to cut the horizontal lines to look just like in the 2nd screen shot can it be done so that the lines will be limited to appear only for the space of 24hrs daily?Thanks {image} {file} {image}
Ignored
Hello,
I have changed your indicator.
Now the lines are displayed only for 24 hours.
Try it.
Looks sorted out in the other thread, but some points:
- error 4200, you can look up the doc for error codes to see what it is
- the while loop doesn't have any condition that will stop it
- the return(0) inside the while loops only occur if the trendline creation fails
- return(0) also stops the whole event function of start() and doesn't proceed to the other gap check, break is more appropriate
- the while loop also doesn't change any conditions, the k incrementing isn't used inside the while(..), it should be an if
I would put the logic as something like
Inserted Code
   //flags to look or not, reset at every tick, ideally would be on a new bar only
   bool found_up = false;
   bool found_dn = false;

   int lookback = number of candles left of the candle being checked that are used

   for(int i=0; i<=Bars-1-lookback; i++){

      //only check for up gap if it hasn't been found
      if(!found_up){
         //if found
         if(gap up conditions met){
            //set flag that its found
            found_up = true;
            //get coords for trendline and make it
            if(!make_trendline()){//if it doesnt exist it'll be made
               //else update coords of trendline gap-up
            }
         }
      }

      //same for gap down

      //if both up n down gaps are found, stop looking altogether
      if(found_up && found_dn){
         break;
      }
   }
Hey i use this indi for sessions on mt5. You can take a look and see if you like it. i just saw your reply i don't know if it's this you are looking for.
...alert every time there is an engulfing pattern...draw my own...rectangle...alert if the bullish engulf price touches that area...
Ignored
Something like, untested:
Inserted Code
   //time of previously completed candle
   long t = Time[1];

   //some stuff to be used
   bool T_any_engulf_F_only_in_rect = true;//maybe as an input with better description

   //only run on a new bar
   if(new_bar(t)){

      //check for a bullish engulfing at candle 1
      if(engulf_bull_check(1)==true){

         //get some price that may be used later, maybe 2 prices for a range
         double engulf_bull_price = High[1];

         //if just an alert
         if(T_any_engulf_F_only_in_rect){
            engulf_alert("bullish engulfing");
         }

         //if an alert and inside some manual rect drawn
         if(!T_any_engulf_F_only_in_rect){

            //name of the rect drawn
            string rect_name = "support rect";

            //get its coords
            long t1 = ObjectGetInteger(0,rect_name,OBJPROP_TIME1);
            long t2 = ObjectGetInteger(0,rect_name,OBJPROP_TIME2);
            double p1 = ObjectGetDouble(0,rect_name,OBJPROP_PRICE1);
            double p2 = ObjectGetDouble(0,rect_name,OBJPROP_PRICE2);

            //clean the coords for use
            long t_left = MathMin(t1,t2);
            long t_right = MathMax(t1,t2);
            double p_upper = MathMax(p1,p2);
            double p_lower = MathMin(p1,p2);

            //check the engulf time and price is within the rect
            if(t_left<=t && t_right>=t){//within time
               if(p_lower<=engulf_bull_price && engulf_bull_price<=p_upper){//within price
                  engulf_alert("bullish engulfing inside support zone");
               }
            }
         }
      }//end if engulf bull found

   }