Attached Image (click to enlarge)

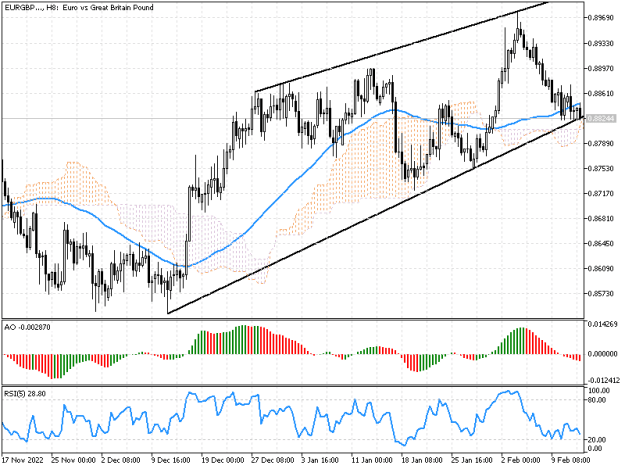
The XRPUSD pair has been actively growing since the beginning of this year as part of the general market trend. However, at present, the upward dynamics have seriously slowed. The price reached three-month highs around 0.4290, after which it rolled back to 0.3906 (Murrey level [8/8]). Fixation below it will give the prospect of further decline to 0.3662 (Murrey level [7/8]) and 0.3418 (Murrey level [6/8]). If the quotes consolidate above the resistance zone of 0.4050 � 0.4150 (middle line of Bollinger bands, Fibonacci correction 38.2%, Murrey level [+1/8]), growth may continue to 0.4395 (Murrey level [+2/8]), 0.4565 (Fibonacci retracement 61.8%) and 0.4750.
Attached Image (click to enlarge)

Resistance levels: 0.415, 0.4395, 0.4565, 0.475 | Support levels: 0.3906, 0.3662, 0.3418
Attached Image (click to enlarge)

Trust Pilot Score 4.8