• Home
  • Forums
  • Trades
  • News
  • Calendar
  • Market
  • Brokers
  • Login
  • Join
  • 9:35pm
Menu
  • Forums
  • Trades
  • News
  • Calendar
  • Market
  • Brokers
  • Login
  • Join
  • 9:35pm
Sister Sites
  • Metals Mine
  • Energy EXCH
  • Crypto Craft

Options

Bookmark Thread

First Page First Unread Last Page Last Post

Print Thread

Similar Threads

Cornflower EA 69 replies

Simple Hourly System 4 replies

Special request: Can someone make a Cornflower EA for us? 24 replies

cornflower mq4 request. 1 reply

"Bagovino Method" VS "Cornflower Hourly System" 16 replies

  • Trading Systems
  • /
  • Reply to Thread
  • Subscribe
  • 458
Attachments: Cornflower Hourly System
Exit Attachments
Tags: Cornflower Hourly System
Cancel

Cornflower Hourly System

  • Last Post
  •  
  • 1 45Page 678 101
  • 1 Page 6 101
  •  
  • Post #101
  • Quote
  • Apr 30, 2007 11:01pm Apr 30, 2007 11:01pm
  •  kalil-jawwad
  • | Joined Jan 2007 | Status: Member | 26 Posts
Thank you so much for your detail explanation Felicia! I will try the 5M tomorrow during the US session. Thanks a lot!
 
 
  • Post #102
  • Quote
  • May 1, 2007 10:54am May 1, 2007 10:54am
  •  Sejake
  • | Joined Apr 2006 | Status: Member | 14 Posts
Hey, nice +65 pip gain on GBPUSD today before the dump....worked well !!
Attached Image (click to enlarge)
Click to Enlarge

Name: gbp.jpg
Size: 152 KB
 
 
  • Post #103
  • Quote
  • May 1, 2007 11:00am May 1, 2007 11:00am
  •  lever70
  • Joined Jun 2006 | Status: sycophant | 285 Posts
Sweet, Sejake. That hourly setup was perfect. Glad you were out before the news. I took 20 off that. What is the EA you have attached to your chart?
 
 
  • Post #104
  • Quote
  • May 1, 2007 11:34am May 1, 2007 11:34am
  •  Sejake
  • | Joined Apr 2006 | Status: Member | 14 Posts
The EA converts the price to a file so I can use it in various third party charting programs.

Regards,

Sejake
 
 
  • Post #105
  • Quote
  • May 2, 2007 5:57pm May 2, 2007 5:57pm
  •  kharvell
  • Joined Dec 2006 | Status: call me Kevin | 1,263 Posts
lever70,

I've already thanked you here before and told you that I use your method, but in a different light. Since it has been so successful for me, I thought I'd share with everyone my way of trading your method. And if it is deemed inappropriate or irrelevant, then let me know.

I'm not sure if anyone has read Jacko's thread in Journal Factory, but let me be the first to tell you that it is a million units in gold. Simple, but extremely effective. Combined with your entries, it is basically Pipsgiving with a fat pip-turkey.

I use Jacko's method to determine the trend:

1) Daily chart

If Price goes from bottom left to top right, the trend is up. If price goes from top left to bottom right, trend is down.

2) 3-Hour chart (4-hour would work, I'm sure)

If Price goes from bottom left to top right, the trend is up. If price goes from top left to bottom right, trend is down.

3) 1-Hour chart

If Price goes from bottom left to top right, the trend is up. If price goes from top left to bottom right, trend is down.

I know what you're thinking... DUH. That's what I thought, too.

Now, if all three timeframes are in an uptrend, then use your entry method for long entries as usual. Vice versa for shorts.

My sole issue with your method was its Risk:Reward. 50 pips risked for 20 pips gained means you better be pretty darn accurate and generate a lot of wins. So, what I do is let the trades run until I look at the hourly chart and it no longer shows the trend I'm in. This improves the Risk:Reward greatly; especially when you are jumping in a long-term trend.

Basically, if I'm long and the hourly chart is going from top left to bottom right, then I exit.


Why am I telling you this? Because I am up 667 pips from the beginning of last week. This represents a 32% increase of my account all in one week and a half's time.

Thanks again and I hope this helps,

Kevin

Here are my current trades:
Attached Image
 
1
  • Post #106
  • Quote
  • May 2, 2007 6:03pm May 2, 2007 6:03pm
  •  billbss
  • Joined Apr 2006 | Status: Member | 4,301 Posts
The amount of zoom put on a chart totally controls whether it shows an uptrend or downtrend using the method you described.

Look at a current GBP/USD 1HR chart.

Zoom it all the way out- you have a marked uptrend.

Zoom it all the way in- you have a marked downtrend.

As you zoom through it, you go from an uptrend, to a sideways trend, to a downtrend.
 
 
  • Post #107
  • Quote
  • May 2, 2007 6:05pm May 2, 2007 6:05pm
  •  kharvell
  • Joined Dec 2006 | Status: call me Kevin | 1,263 Posts
Quoting billbss
Disliked
The amount of zoom put on a chart totally controls whether it shows an uptrend or downtrend using the method you described.

Look at a current GBP/USD 1HR chart.

Zoom it all the way out- you have a marked uptrend.

Zoom it all the way in- you have a marked downtrend.
Ignored
This is why using multiple timeframes is key... I try to include about 100 or so candles in my chart window.

Good luck,

Kevin
 
 
  • Post #108
  • Quote
  • May 2, 2007 10:56pm May 2, 2007 10:56pm
  •  fayz0r
  • | Joined Mar 2007 | Status: UberFay: Lebanese FTW!!! | 156 Posts
Hello

Nice system

can someone Code an indicator that alert when 8,12,24 EMA's Cross?

Thank you
Fay All Time Return: -98.7%
 
 
  • Post #109
  • Quote
  • May 2, 2007 11:08pm May 2, 2007 11:08pm
  •  lever70
  • Joined Jun 2006 | Status: sycophant | 285 Posts
Kharvell, great trading. Glad to see that this system with the ridiculous name is working for you.

Today we had multiple opportunities for entry on cable.

http://img465.imageshack.us/img465/8...flower4sp3.gif

Every pullback to the 12 EMA was tradable. If you were using the 5 min you could have timed these nicely. I suspect we will get a deeper pullback in the next 24+ hours as traders position themselves for NFP; how far is anyone's guess. There are also two news events that pose event risk, so be on your toes.
 
 
  • Post #110
  • Quote
  • May 2, 2007 11:10pm May 2, 2007 11:10pm
  •  lever70
  • Joined Jun 2006 | Status: sycophant | 285 Posts
One other thing, I am not risking 50 pips to make 20. The 50 pip stop is if you are trading longer-term like Kharvell. When I am looking to make 20 intraday my stop is tight, about 10 pips. Of course, it is good to let it run past 20 if it clearly wants to.
 
 
  • Post #111
  • Quote
  • May 3, 2007 4:42am May 3, 2007 4:42am
  •  ramrocket
  • | Joined Dec 2006 | Status: Colorado, USA | 96 Posts
Quoting kharvell
Disliked
lever70,
Basically, if I'm long and the hourly chart is going from top left to bottom right, then I exit.

Kevin
Ignored
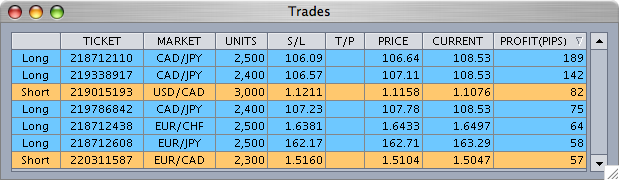
Kevin, I don't understand "top left to bottom right..." what are you talking about? Looks like you trade the CAD/JPY quite a bit. I have never traded this pair. Will take a look at it.
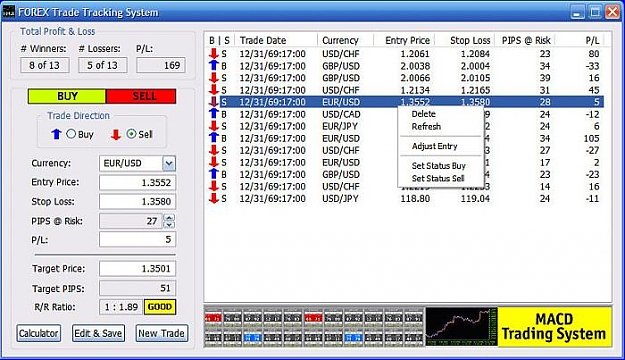
Regarding R:R
Here is a little program I wrote to help me track my trades, P/L, etc. I offered this also to all of Phil's MACD traders. Use the spinner to adjust SL. I have also incorporated the R/R program into this one. Send me an email if you can use it. Feel free to suggest any improvements as I use it everyday.


To your success,
[email protected]
Attached Image (click to enlarge)
Click to Enlarge

Name: macd_software.jpg
Size: 71 KB
 
 
  • Post #112
  • Quote
  • May 3, 2007 10:09am May 3, 2007 10:09am
  •  agtmiller
  • | Joined Oct 2006 | Status: Member | 6 Posts
Do we use the same method for a bounce as we do for a cross?


So would it be a good idea to wait for pulback on the euro/usd at about 9:00 central time?
Thanks in advance.
 
 
  • Post #113
  • Quote
  • May 3, 2007 12:53pm May 3, 2007 12:53pm
  •  lever70
  • Joined Jun 2006 | Status: sycophant | 285 Posts
Quoting agtmiller
Disliked
Do we use the same method for a bounce as we do for a cross?


So would it be a good idea to wait for pulback on the euro/usd at about 9:00 central time?
Thanks in advance.
Ignored
We don't trade crosses. Crosses merely indicate trend direction. We pullbacks/trend resumptions from key EMAs, or the breakout from the 72 EMA on the 30M chart, or the breakout from a congestion area above or below the 72 EMA. The longer term exit is the 12 crossing the 24 on the 1 hr chart.

As for EURUSD, I would not enter a position the day before NFP after the peak of the NY session. In fact, let's make that a rule:

No new positions are to be entered after 10am NY Time on the day before non-farm payroll. Holding positions is at the trader's discretion, but an exit is recommended if you are in profit.

Expect a lot of choppiness until NFP and perhaps a pullback to the 72 EMA.
 
 
  • Post #114
  • Quote
  • May 4, 2007 10:09am May 4, 2007 10:09am
  •  aktaurus
  • | Joined Dec 2006 | Status: Member | 146 Posts
Hi and thanks for sharing!

Quoting lever70
Disliked

Today we had multiple opportunities for entry on cable.

http://img465.imageshack.us/img465/8...flower4sp3.gif

Every pullback to the 12 EMA was tradable.
Ignored
Don't you wait for candle close? Do you use a moment of price pulling into area, not candle-close?

Then how do you know that it's pullback, not trend changing?

Thank you!
 
 
  • Post #115
  • Quote
  • May 4, 2007 10:54am May 4, 2007 10:54am
  •  ramrocket
  • | Joined Dec 2006 | Status: Colorado, USA | 96 Posts
short on USD/CHF @ 1.2152 closed @ 1.2105. It is still going down - I think it will hit the next stop @.2094 but I am happy with 47 pips.

+47 pips gain
 
 
  • Post #116
  • Quote
  • May 4, 2007 1:03pm May 4, 2007 1:03pm
  •  aktaurus
  • | Joined Dec 2006 | Status: Member | 146 Posts
Quoting ramrocket
Disliked
short on USD/CHF @ 1.2152 closed @ 1.2105.
Ignored
Could you please explain: how did you entered short if EMA72 showing up-trend? I mean WHY did you used this movement as break EMA72 and not as pull down? Well, why short?

Thank you!
 
 
  • Post #117
  • Quote
  • Edited 1:50pm May 4, 2007 1:43pm | Edited 1:50pm
  •  ramrocket
  • | Joined Dec 2006 | Status: Colorado, USA | 96 Posts
Quoting aktaurus
Disliked
Could you please explain: how did you entered short if EMA72 showing up-trend? I mean WHY did you used this movement as break EMA72 and not as pull down? Well, why short?

Thank you!
Ignored
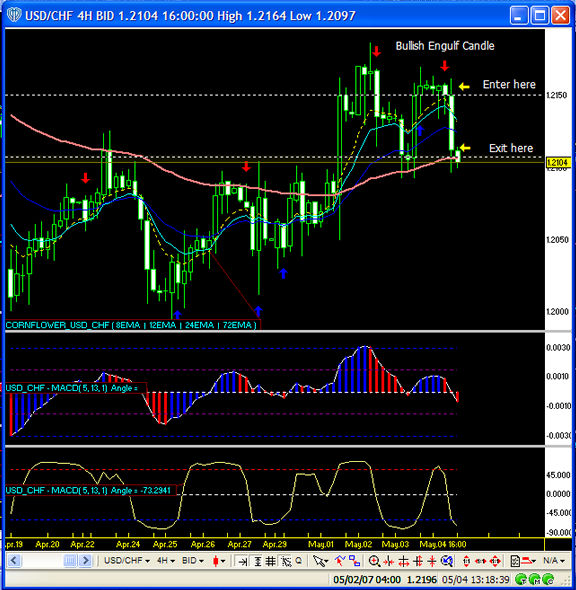
Look at the chart and price action. This is a counter trend on 4H target is 72EMA. The reasons why I took this trade are:

1. Prev candle showing bearish engulfing
2. MACD confirmation round top - short direction
3. R:R is good +50 pips to 72EMA

Once price breaks 74.2 fib, it will likely to continue to 100 as you can see on the chart but I closed my position knowing that the 72EMA is present. I hope this make sense.

Chart correction: Bearish Engulf instead of Bullish
Attached Image
 
 
  • Post #118
  • Quote
  • May 4, 2007 2:01pm May 4, 2007 2:01pm
  •  aktaurus
  • | Joined Dec 2006 | Status: Member | 146 Posts
Now clean. Thank you!
 
 
  • Post #119
  • Quote
  • May 4, 2007 2:06pm May 4, 2007 2:06pm
  •  ramrocket
  • | Joined Dec 2006 | Status: Colorado, USA | 96 Posts
Quoting aktaurus
Disliked
Now clean. Thank you!
Ignored
EUR/USD just broke the 72EMA so here is my next pending trade. I might let this one stay open over the weekend.

+10 pips so far.
Attached Image
 
 
  • Post #120
  • Quote
  • May 4, 2007 2:39pm May 4, 2007 2:39pm
  •  kalil-jawwad
  • | Joined Jan 2007 | Status: Member | 26 Posts
I'm impressed! Good job!
 
 
  • Trading Systems
  • /
  • Cornflower Hourly System
  • Reply to Thread
    • 1 45Page 678 101
    • 1 Page 6 101
0 traders viewing now
  • More
Top of Page
  • Facebook
  • Twitter
About FF
  • Mission
  • Products
  • User Guide
  • Media Kit
  • Blog
  • Contact
FF Products
  • Forums
  • Trades
  • Calendar
  • News
  • Market
  • Brokers
  • Trade Explorer
FF Website
  • Homepage
  • Search
  • Members
  • Report a Bug
Follow FF
  • Facebook
  • Twitter

FF Sister Sites:

  • Metals Mine
  • Energy EXCH
  • Crypto Craft

Forex Factory® is a brand of Fair Economy, Inc.

Terms of Service / ©2023