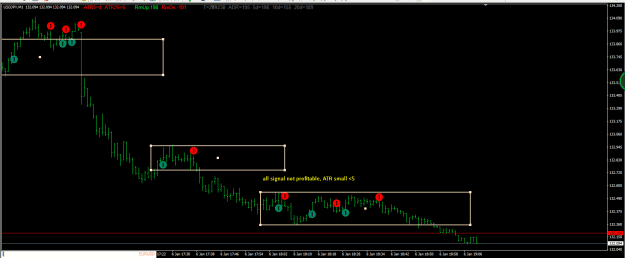
(Continued of the previous post. Question how to use ATR to help you make better judgment when there is a good signal)
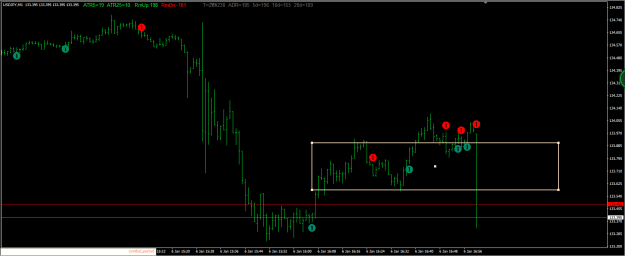
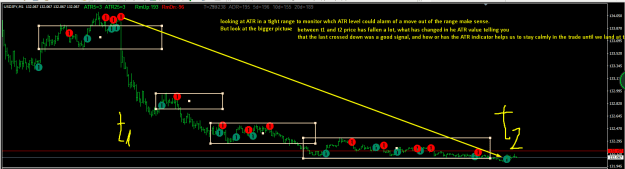
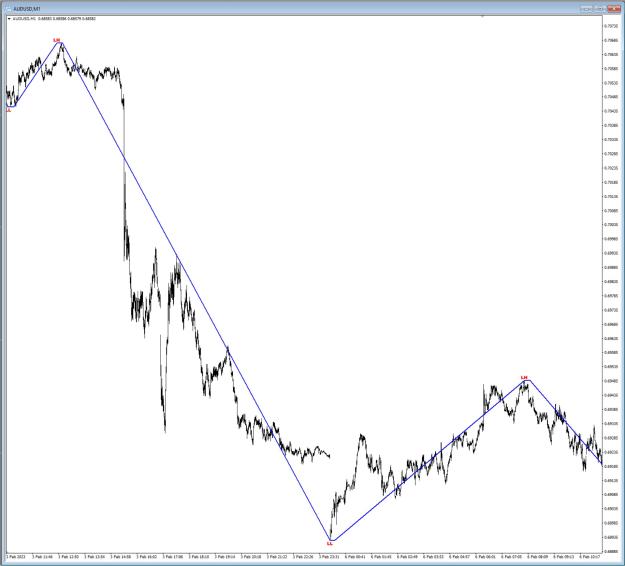
what from this Xart help us to enter for the right time in the trade from t1 to t2, what would be ATR look like to alarm the timing when price would leave this low level, in form of doing a rotation or when price revers after hit Supply/demand zone.
(I guess again when price already rises at least 50% level, because all indicator calculation are based on price on average of price , so nothing can alarm us sooner ) But what in the Xard could tell us a SELL trade from t1 could be profitable and less probability a flop?
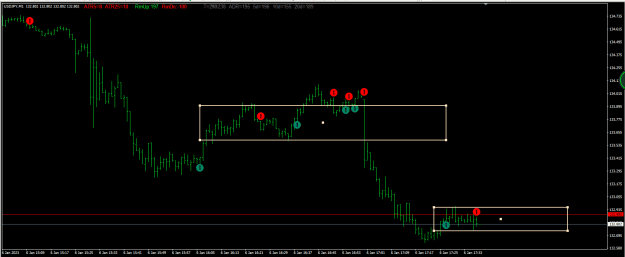
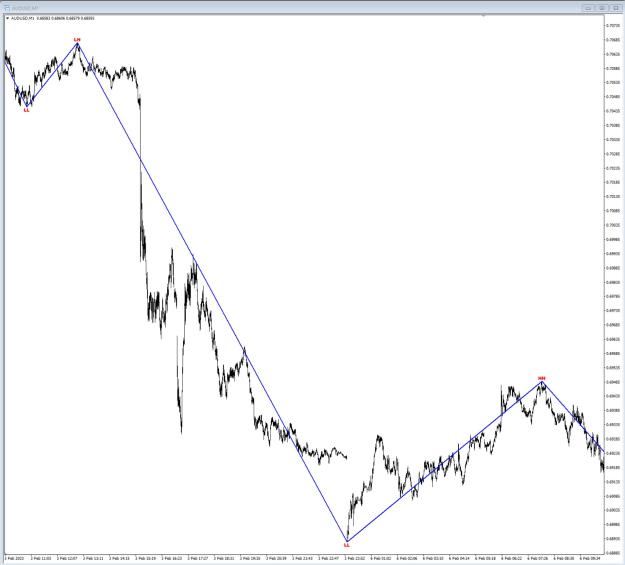
Attached Image(s) (click to enlarge)