Based on this post by [redacted for privacy] (Parisboy)
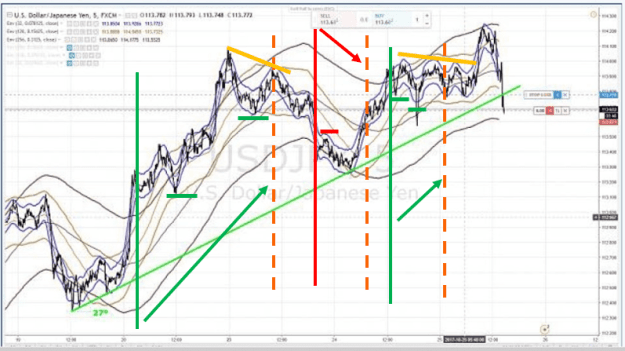
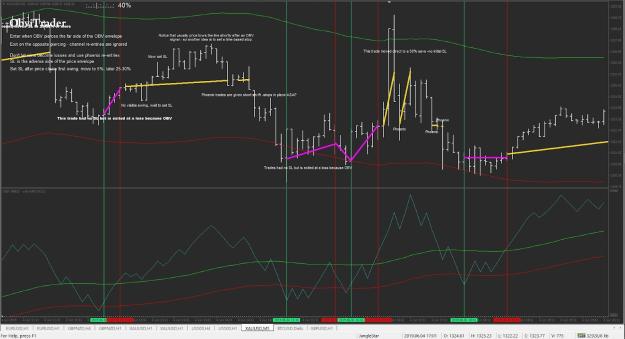
So it’s fairly simple. Using his bands (or yours - any will do, likely) simply find setups where
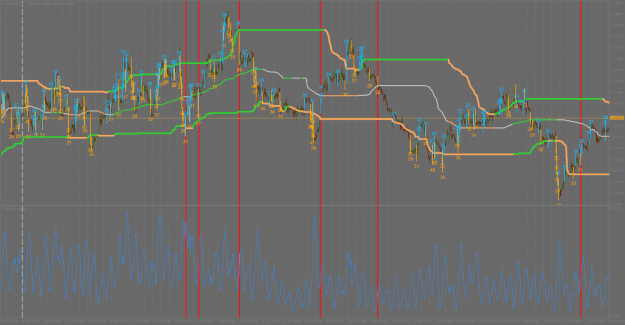
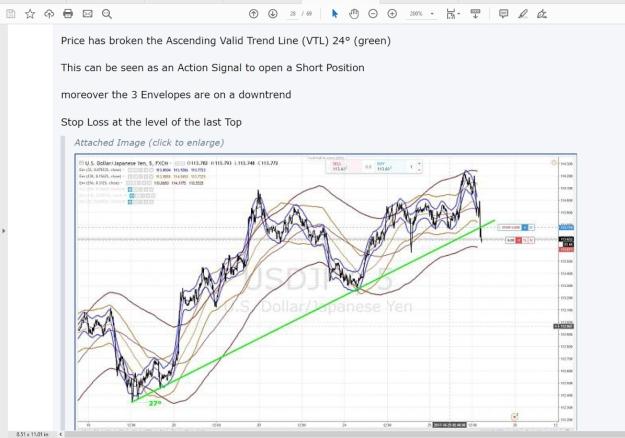
- 3 bands are pointing up or down, united (but wait for price to be on the non-trend side of the third band - buy the dip)
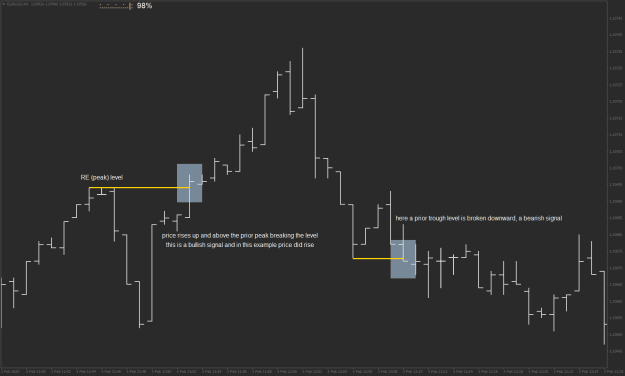
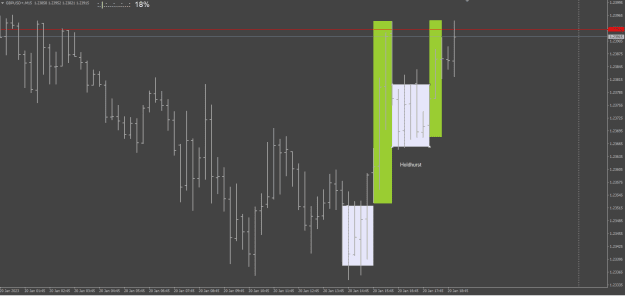
- Price has crossed your (preferably Hurst-valid, but...who cares?) trendline
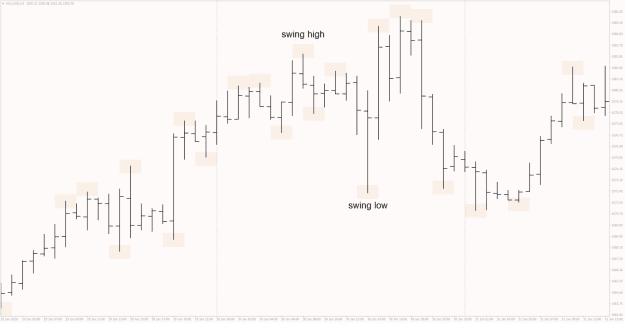
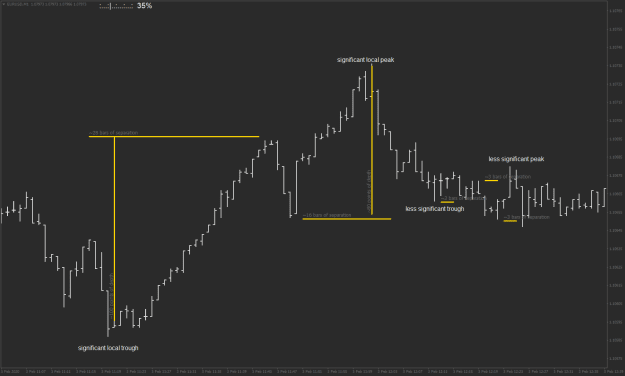
- SL at last relative extrema as advised
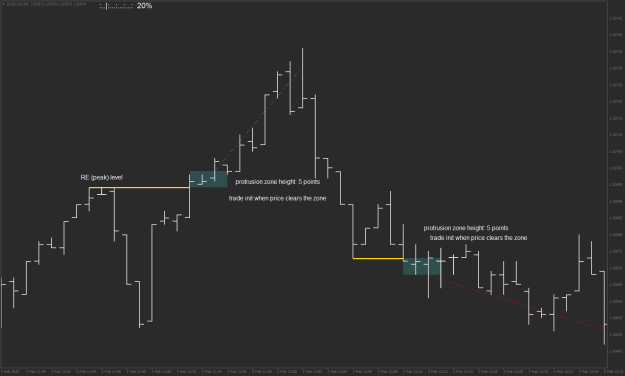
- Then enter.
- Target ---> The same distance as price moved to cross the trendline - again, as per Hurst.
How important is it that the innermost or outermost bands are turning? If you wait for a droop in the innermost you’ll be past the trendline break and if you wait for a droop in the outermost you’ll be way too late, and vice versa for longs.
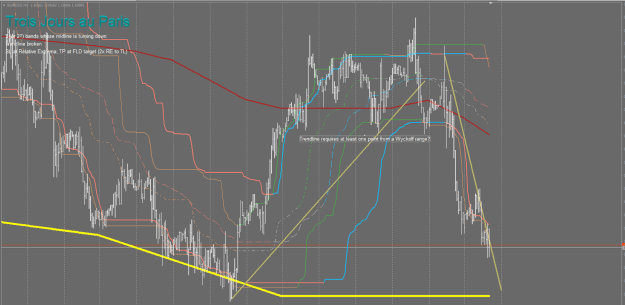
Trendlines require a point in a wyckoff range maybe 2019-11-25 07.22.31
More questions:
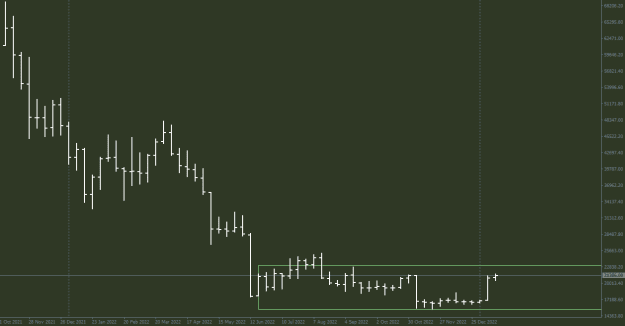
Is it better to use the band crossing points as supports for trendline ‘bridges’ rather than actual peaks (my research suggests yes). (interesting)
Peaks may be better associated with other (higher) TF not represented by the current band. Then again you often get earlier entries with steeper lines (associated with hinging on peaks).
Even if I have got some details wrong, (missing the FLD for example) this is a far more sensible way to trade than anything I've shared yet, and the only reason I share it openly is because the maestro has already given us everything we need at his thread which you should be reading instead of this rambling by a journeyman.


![Click to Enlarge
Name: 330px-Extrema_example_original.svg[1].png
Size: 6 KB](/attachment/image/4377181/thumbnail?d=1674138170)