{quote} Up and down every month or just rotations?
Ignored
Not sure what you mean by rotations. Just draw the lines and every Sunday update/modify them as new candlesticks print. Every month you will need to update your previous month high/low for sure, and every weekend on Sunday just update your Weekly and Daily lines. Then trade price around these lines using any method of choice (market structure + Fibonacci, or S&D, or combination, etc)
Alright, time for psychological levels. Rules: 1. Draw thin horizontal lines starting from Monthly chart all the way down to Daily Chart. Sometimes H4 depending on the price action. 2. Beginning with Monthly, identify key areas where candle BODY open/closes are respected. Pay attention to my screenshots below. Notice how clean the candles respect each level. 3. In addition to these levels, mark the LAST month's high and low 4. For EACH line you draw, round it up/down to the nearest .50, .00, or .25 5. As you come down from Monthly to Daily, fix...
Ignored
I did not understand the 5th point.
Also I noticed on weekly chart, some lines drawn of monthly charts have been removed, I am still confused in drawing levels.
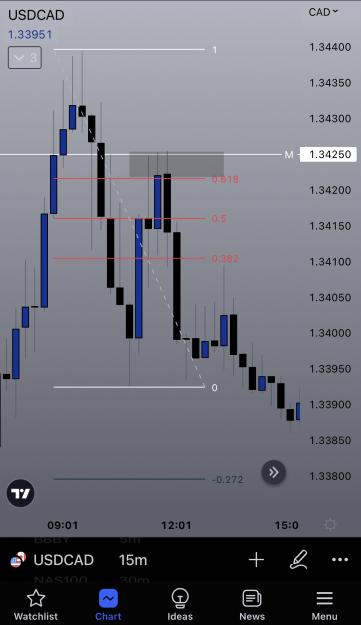
Price makes a run to the monthly psych level, goes above to capture the liquidity and collapses back down, retraces back up to retest the monthly psych and melts back down. Using fib notice how it closes just around 61.8, and just wicks the monthly psych level. When you see this, you can drill down further into 5m or 1m to get a nice precise high r:r entry.
{quote} I did not understand the 5th point. Also I noticed on weekly chart, some lines drawn of monthly charts have been removed, I am still confused in drawing levels.
Ignored
You first draw your monthly lines. When you go down to weekly, some of the candlestick closes become more clear so you modify the monthly lines as needed or simply draw a weekly line if the modification will move the line very far. So if the move is less than 50-100 pips then you can move it otherwise draw new weekly line.
{quote} You first draw your monthly lines. When you go down to weekly, some of the candlestick closes become more clear so you modify the monthly lines as needed or simply draw a weekly line if the modification will move the line very far. So if the move is less than 50-100 pips then you can move it otherwise draw new weekly line.
{quote} Not sure what you mean by rotations. Just draw the lines and every Sunday update/modify them as new candlesticks print. Every month you will need to update your previous month high/low for sure, and every weekend on Sunday just update your Weekly and Daily lines. Then trade price around these lines using any method of choice (market structure + Fibonacci, or S&D, or combination, etc) let me know if it’s still unclear.
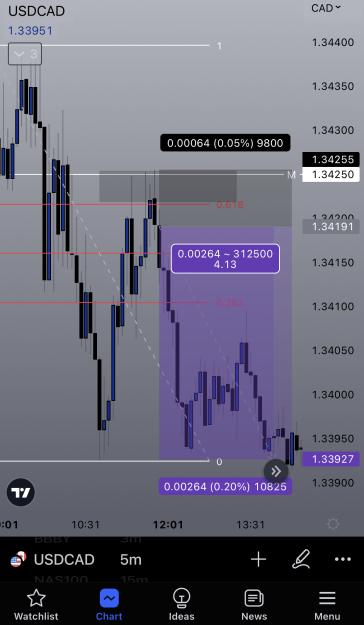
Setup on UC 15m: Price makes a run to the monthly psych level, goes above to capture the liquidity and collapses back down, retraces back up to retest the monthly psych and melts back down. Using fib notice how it closes just around 61.8, and just wicks the monthly psych level. When you see this, you can drill down further into 5m or 1m to get a nice precise high r:r entry. {image} For example, entry on 5m: {image}
Ignored
Nice one. So for this entry you waited for the rejection at the monthly level and opened the trade on opening of the next M5 candle?
{quote} Nice one. So for this entry you waited for the rejection at the monthly level and opened the trade on opening of the next M5 candle?
Ignored
Correct. So I saw price made a move above the Monthly psych level, but didn't sustain long and fell back down. Then it rose back up to re-test the Monthly psych level once again, and for this I observed the price action on 15m/5m to find a proper entry. The wicks you see on 5m is testament to the fact that price is failing to make a break above the monthly psych level, hence you enter on the first confirmation of a bearish candlestick as you see on my entry there.
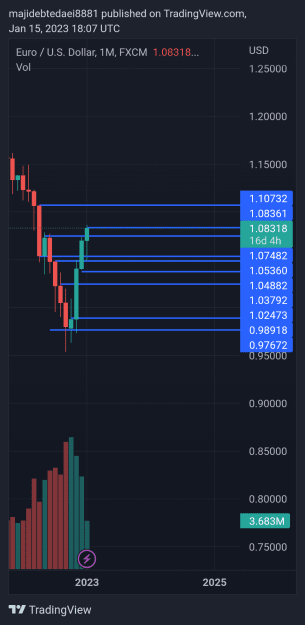
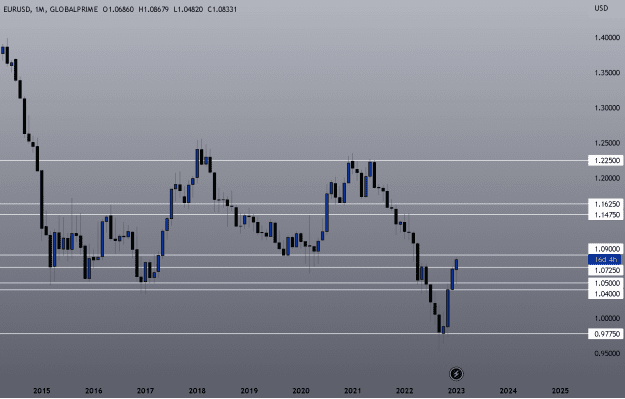
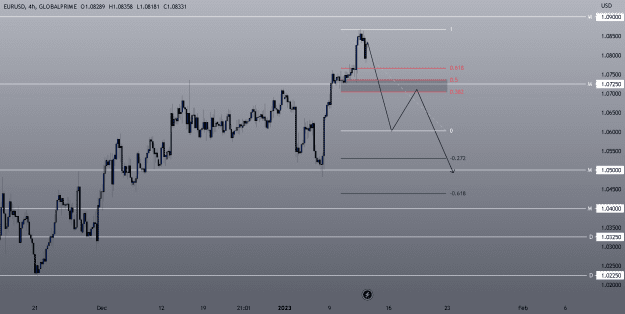
Hi, make sure you look at the bigger picture when drawing your lines. Look left a bit as some Monthly levels can still hold. And you want to coincide as many key levels as possible, not necessarily draw every single reversal. I've marked up EU for you on Monthly. Try to make sense of what I have and do the same.
{quote} Hi, make sure you look at the bigger picture when drawing your lines. Look left a bit as some Monthly levels can still hold. And you want to coincide as many key levels as possible, not necessarily draw every single reversal. I've marked up EU for you on Monthly. Try to make sense of what I have and do the same. {image}
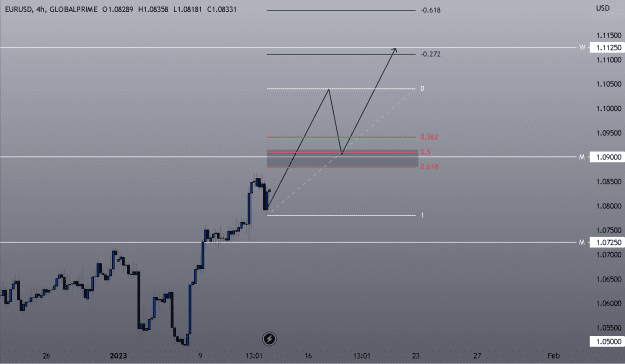
Two things can happen. If EU breaks above the upcoming monthly psych level, then look for a pullback to re-test the psych level using Fibonacci retracement and enter by drilling down on lower timeframes to find the perfect entry.
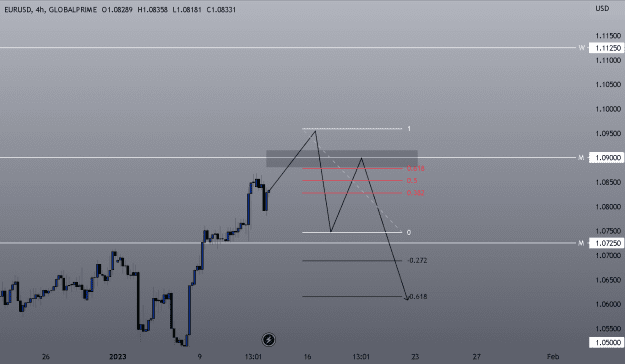
Another possibility is like the previous example: it fails to break above Monthly and sustain, comes back down, and then re-tests the same Monthly psych level. In which case you do the same. You wait for it to collapse, re-test, and then you snipe your entry on a lower timeframe using the Fib retracement. Recall my previous UC example it's very similar.
Scenario #1: Breaks above and makes higher highs
Attached Image (click to enlarge)
Scenario #2: Breaks above but fails to sustain, breaks back down
One more thing I should mention. This is a trading style that requires patience for the best setups to come to you. Don't force a trade, don't trade every single day. Make 3-5 trades a month, and bag your 10-15% and live a happy life. Don't trade for the sake of trading, be patient and let the market do its thing. This took me a long time to overcome, but you will if you are patient and treat this seriously.
{quote} Two things can happen. If EU breaks above the upcoming monthly psych level, then look for a pullback to re-test the psych level using Fibonacci retracement and enter by drilling down on lower timeframes to find the perfect entry. Another possibility is like the previous example: it fails to break above Monthly and sustain, comes back down, and then re-tests the same Monthly psych level. In which case you do the same. You wait for it to collapse, re-test, and then you snipe your entry on a lower timeframe using the Fib retracement. Recall...
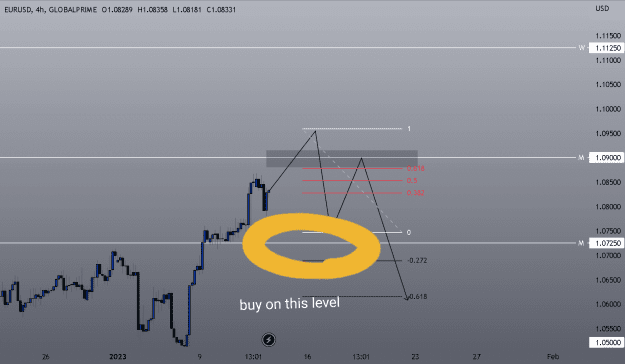
Not necessarily a buy immediately. Watch the level. It lands on a 38% fib which is not my preferred fib to enter but if enough confluence with wicking and lower tf candlestick then I may consider. It may not make it down there so all we can do is wait for it to arrive at our psych levels to see what it's reaction is.
Here's the markup. This is not very ideal as I said because of the steep retracement that can occur hence the 38.2% being at the monthly is not the strongest signal, but it's still valid and all you can do is wait for price to come there to see what can happen. It can even break below the level, and then retrace to re-test it. That's a possibility as well.
What I did before was markup every 10 pips level on chart. On 1 minute chart. You might guys notice how price create low or high, restest it and goes away. This was also nice, since you could get 10 pips easily with SL 2 or 3 pips. Entry must be on created high or low. Not after, not before otherwise your SL would be bigger. That's not good.
So guys, this thread really rulez. There is truth behind it. Much better than sharing some kind of system with 20 indicators & tons of colors.
Those threads are always best. Having some fun. And sorry OP for smaller off-topic maybe. I just wanted to share this though.
What I did before was markup every 10 pips level on chart. On 1 minute chart. You might guys notice how price create low or high, restest it and goes away. This was also nice, since you could get 10 pips easily with SL 2 or 3 pips. Entry must be on created high or low. Not after, not before otherwise your SL would be bigger. That's not good. So guys, this thread really rulez. There is truth behind it. Much better than sharing some kind of system with 20 indicators & tons of colors. Those threads are always best. Having some fun. And sorry...
Ignored
No, please don't apologize. Thank you for sharing your style of trading!
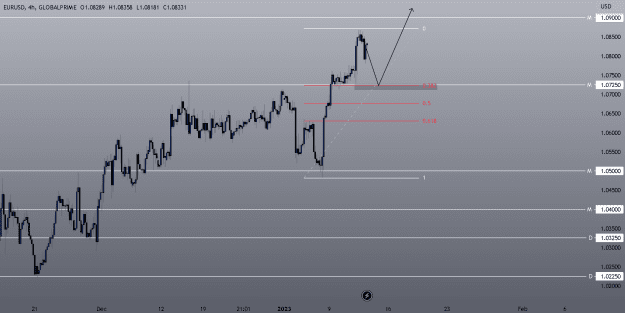
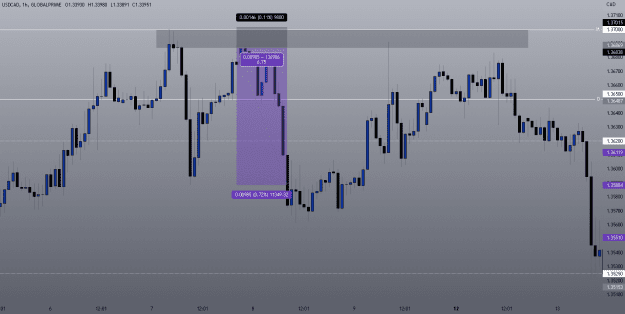
Putting it all together. Price goes up to test Monthly psych level, fails to close above it, then falls down. But the fall is a familiar setup - it's a huge supply zone. Wait for price to come back up to load up on more supply and just melts away. A sweet 6.75:1 setup. Risking 1% would have netted you 6.75%. You don't need to trade anymore for the whole month. Compound earnings like this and you're on your way to trading full time for a living, without doing 1/10th the effort of day trading.
Putting it all together. Price goes up to test Monthly psych level, fails to close above it, then falls down. But the fall is a familiar setup - it's a huge supply zone. Wait for price to come back up to load up on more supply and just melts away. A sweet 6.75:1 setup. Risking 1% would have netted you 6.75%. You don't need to trade anymore for the whole month. Compound earnings like this and you're on your way to trading full time for a living, without doing 1/10th the effort of day trading. {image}
Ignored
Why didn't price react well to the daily psychological level?