{quote} I think if you're serious about this approach. You should read the first 10 pages carefully, then read all the pages as best. This is the experience of someone who has spent more than 20 years trading. I know some people who have learned his methods and have succeeded. Most of them learn theory in a few months and practice within a year. Some have become Financial Freedom thanks to this method. So be patient.
Ignored
Thank you for the encouragement! yes i mean to be serious and willing to work hard for it. But i'm a bit informationflooded so i am at crossroads about which strategy/strategies to focus on. I'm watching alot of ICT videos, but Nala's method make alot of sense.
You have an IQ lower than 90 if you interact with this user.
{quote} Thank you for the encouragement! yes i mean to be serious and willing to work hard for it. But i'm a bit informationflooded so i am at crossroads about which strategy/strategies to focus on. I'm watching alot of ICT videos, but Nala's method make alot of sense.
Ignored
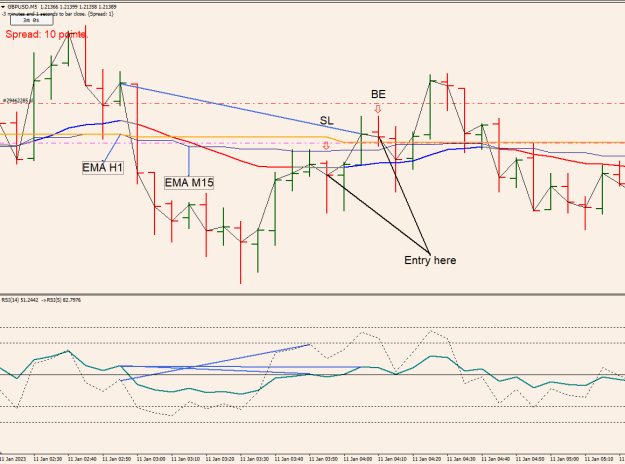
The core of this approach is that the exponential moving average (EMA) is not divergent. The goal of the last entry is to capture the movement of the EMA shaping the take profit (TP) during the day. Divergences are just fulcrums and signals. Typically, Alan's first entries at the beginning of a divergence have a small volume because the risk ratio is high and often close to the break even (BE) point. Therefore, it is advisable to put a few pips into the account to lower the risk. To implement this approach, there are three steps to follow:
Learn the movement of the EMA in the M5 and H1 time frames. This will also yield a decent number of pips. It is important to determine the direction of the price, as this will inform the TP using pending orders.
Learn timing entry at divergences. Entries at divergences always have a high risk, so it is advisable to lower the volume and close the BE+ position. If the price performs well, one or two more entries should be sufficient for the day. By learning this, you will enter into a HEDGE position.
Familiarize yourself with hooks, pullback tests, and divergences. These situations occur every day and can be challenging to handle. To avoid being swayed by these issues, it is helpful to put step 1 (learning the movement of the EMA) at the top of your priorities. If you can effectively handle these three situations, you will likely earn more pips. However, if you struggle with them, it may be best to stay out and wait for signals from the EMA.
Zoo points are points to consider for entry and involve analyzing the entire time frame from D1 to M1. However, if you follow the above three steps, you should still be able to earn a sufficient number of pips for the day.
{quote} The core of this approach is that the exponential moving average (EMA) is not divergent. The goal of the last entry is to capture the movement of the EMA shaping the take profit (TP) during the day. Divergences are just fulcrums and signals. Typically, Alan's first entries at the beginning of a divergence have a small volume because the risk ratio is high and often close to the break even (BE) point. Therefore, it is advisable to put a few pips into the account to lower the risk. To implement this approach, there are three steps to follow:...
Ignored
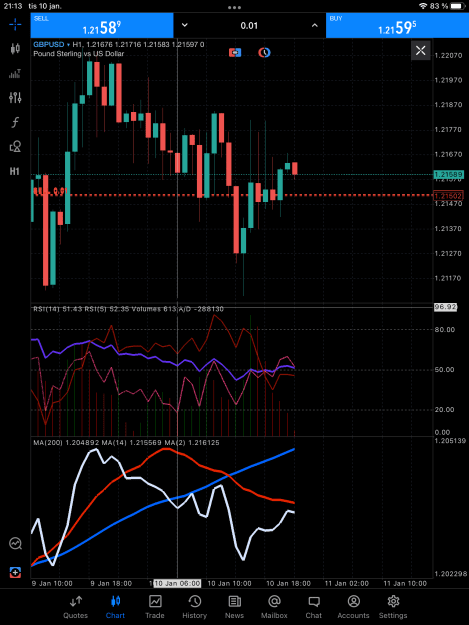
Thank you for good and consistent explaination. I noticed an RSI-divergence today on the hourly chart of GBP/USD.
From 6 am to 14 pm central european time, the fast RSI goes up while the slow RSI goes down, the bottom of the fast RSI rises while the bottoms of the slow RSI declines, does this qualify as an divergence?
If i see the divergence, how long should it take to manifest itself on the hourly chart? If i see it on the 5 min chart how long can it take?
RSI divergence usually leads price to reach the EMA in the opposite direction of the previous move?
You have an IQ lower than 90 if you interact with this user.
{quote} Thank you for good and consistent explaination. I noticed an RSI-divergence today on the hourly chart of GBP/USD. From 6 am to 14 pm central european time, the fast RSI goes up while the slow RSI goes down, the bottom of the fast RSI rises while the bottoms of the slow RSI declines, does this qualify as an divergence? If i see the divergence, how long should it take to manifest itself on the hourly chart? If i see it on the 5 min chart how long can it take? RSI divergence usually leads price to reach the EMA in the opposite direction of...
Ignored
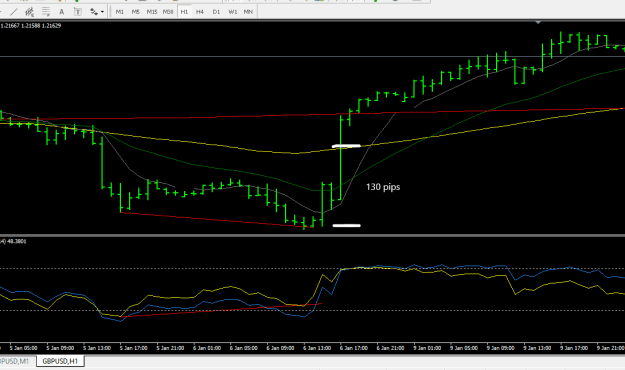
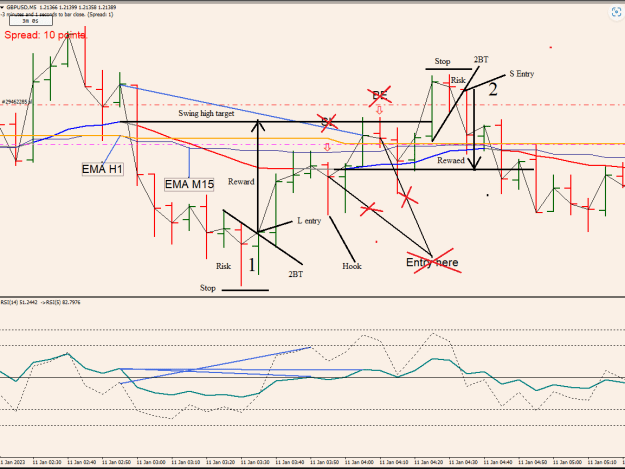
You could just trade the H1 divergence if your chart time is limited. target the H1 EMA or H4 EMA like in the picture for 130 ish pips. Not so many signals tho.
{quote} You could just trade the H1 divergence if your chart time is limited. target the H1 EMA or H4 EMA like in the picture for 130 ish pips. Not so many signals tho. {image}
Ignored
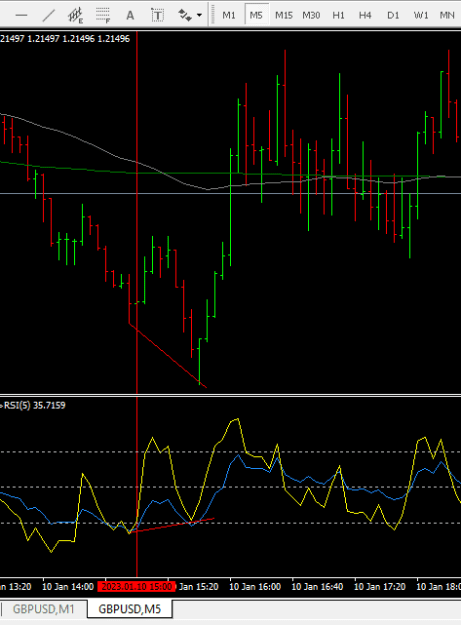
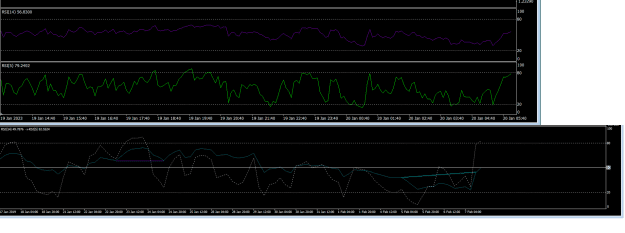
i mean this RSI divergence starting from 6 am and ending about 14:00.
Attached Image (click to enlarge)
You have an IQ lower than 90 if you interact with this user.
{quote} i mean this RSI divergence starting from 6 am and ending about 14:00. {image}
Ignored
Yes RSi divergence X 2. When we get divergence it means EMA will be crossed. The first occurrence was a bit dubious being so close to the EMA but the second was good for 30 pips plus a bit of DD if you happen to be at your terminal at that time. Been a bit busy of late with normal work stuff.
{quote} Yes RSi divergence X 2. When we get divergence it means EMA will be crossed. The first occurrence was a bit dubious being so close to the EMA but the second was good for 30 pips plus a bit of DD if you happen to be at your terminal at that time. Been a bit busy of late with normal work stuff. {image}
Ignored
Thank you, nemas problemas! Im very new to this. Where would you say your entry points would be on this trade?
at which times according to the chart. What is your EMA set too in time frame? The RSI is the bottom one and the EMA are the two lines following price?
You have an IQ lower than 90 if you interact with this user.
{quote} Thank you, nemas problemas! Im very new to this. Where would you say your entry points would be on this trade? at which times according to the chart. What is your EMA set too in time frame? The RSI is the bottom one and the EMA are the two lines following price?
Ignored
You wont really know that it is divergence on the H1 until the next candle has closed up. But with the RSI being oversold below 30 there is a good chance that this is the reversal point somewhere on this next H1 candle. If you drop to the M5 and find divergence there as well then your entry point is there. The red vertical is the H1 candle after our suspected H1 divergence. My MA lines are MTF 26 EMA . I posted them a while back.
The hardest thing for me right now is the timing of the entry. If I get a good entry then I can quickly bring it back to BE which helps protect the entry. but entering too early is also a mistake sometimes causing me to have SL continuously before entering the correct order. we can see that alan always has very good timing entries at the tail of the candle which helps him to quickly defend his position.
So can anyone show me some ways to have a better entry. I know about how he uses pending oder for 2bt and HDdiv, what about entry for regular divs?
The hardest thing for me right now is the timing of the entry. If I get a good entry then I can quickly bring it back to BE which helps protect the entry. but entering too early is also a mistake sometimes causing me to have SL continuously before entering the correct order. we can see that alan always has very good timing entries at the tail of the candle which helps him to quickly defend his position. So can anyone show me some ways to have a better entry. I know about how he uses pending oder for 2bt and HDdiv, what about entry for regular divs?...
Ignored
The first thing to note about this chart is the convergence of the EMA's meaning this market time is as flat as a pancake.
1st question we ask is .. Is it worth trading for the risk involved?
This is way before the 108 so don't expect too much it is the most common time for flat markets.
2nd this is a 5 min chart so the entry should be on the 1 min chart to get the least risk. The reward is still based on the 5 min, so we get least risk for max reward.
Since these moves are so very small it cost a lot of money to attempt even a 1% profit. The less distance the more the cost.
The chart would look like this....
Attached Image (click to enlarge)
Waiting for the 108 bar we had a very nice bear div with the potential to take it down some 70 pips to the 4-hour EMA, well worth a 2% trade with a stop of 1% at an initial 35pips. Finding support below the 5 min EMA another 2% trade could have been taken and the stop moved to maintain that 1% risk.
The set of EMA's are spreading apart so we are in good order and eventually make a nice profit.
{quote} The first thing to note about this chart is the convergence of the EMA's meaning this market time is as flat as a pancake. 1st question we ask is .. Is it worth trading for the risk involved? This is way before the 108 so don't expect too much it is the most common time for flat markets. 2nd this is a 5 min chart so the entry should be on the 1 min chart to get the least risk. The reward is still based on the 5 min, so we get least risk for max reward. Since these moves are so very small it cost a lot of money to attempt even a 1% profit....
Ignored
Thank you alan for the detail in the answer.
Yesterday I started practicing with pending oder entries after 2bt. It is extremely effective in getting good entries that I didn't realize until now.
Hi guys, I can install 2 RSI but I can't combine them in 1 RSI zone. I used to use "Apply to: Previous Indicator's Data" for RSI 5 but it always displays "Close" in "Apply" section after applying. So I install RSI 14 with default setting and RSI 5 with "Apply to: Close", it will be correct right? Have a good day
Chào các bác, em cài được 2 RSI nhưng không gộp được vào 1 vùng RSI. Tôi đã từng sử dụng "Áp dụng cho: Dữ liệu của chỉ báo trước" cho RSI 5 nhưng nó luôn hiển thị "Đóng" trong phần "Áp dụng" sau khi áp dụng. Vậy là mình cài đặt RSI 14 với setting mặc định và RSI 5 với "Apply to: Close" thì sẽ đúng đúng không? Chúc một ngày tốt lành...
Ignored
you can see post 7390, it has a download file you just need to add
Sorry Alan, I have a question, on how to set your current stop loss (not immediately after the tested candle or 10pip). With such a large price gap, will you close the order when the price is not running as you want?
{quote} you can see post 7390, it has a download file you just need to add
Ignored
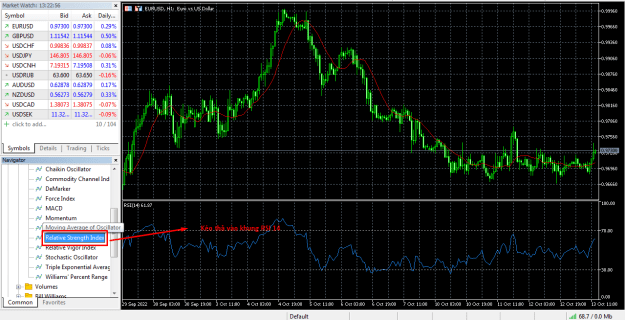
No, I mean RSI indicator. I installed RSI 5 with "Apply to: Previous Indicator's Data" but the chart still display 2 the separate RSI. How to merge 2 RSI in zone like the below picture. Thank a lot
{quote} No, I mean RSI indicator. I installed RSI 5 with "Apply to: Previous Indicator's Data" but the chart still display 2 the separate RSI. How to merge 2 RSI in zone like the below picture. Thank a lot {image}
Ignored
First open an rsi chart, then drag and drop the rsi indicator onto that chart.
Hi Alan, I read this thread from first post. It sound great and thank you for sharing this strategy. I sometimes confuse AB=CD and ABCD. So when we use ABCD and when we use AB=CD. In Post 5,861, I see you add AB=CD and ABCD .