Gold Price Consolidates Losses, Crude Oil Price Could Correct Gains

Gold price started a fresh decline below the $1,785 support zone. Crude oil price struggling near $78 and might correct gains in the near term.
Important Takeaways for Gold and Oil 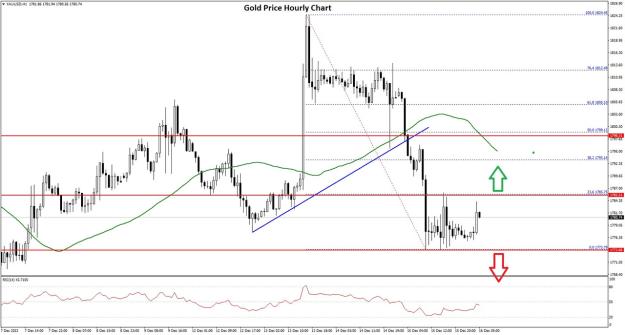
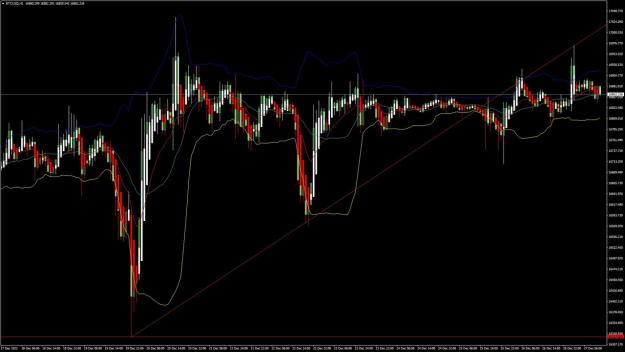
The price settled below the $1,785 level and the 50 hourly simple moving average. It traded as low as $1,773 on FXOpen and is currently consolidating losses. On the upside, the first major resistance is near the $1,785 level.
The 23.6% Fib retracement level of the downward move from the $1,824 swing high to $1,773 swing low is also near the $1,785 level. The main resistance is now forming near the $1,800 level and the 50 hourly simple moving average.
The 50% Fib retracement level of the downward move from the $1,824 swing high to $1,773 swing low is also near the $1,800 level, above which it could even test $1,820. A clear upside break above the $1,820 resistance could send the price towards $1,840.
An immediate support on the downside is near the $1,772 level. The next major support is near the $1,760 level, below which there is a risk of a larger decline. In the stated case, the price could decline sharply towards the $1,750 support zone.
VIEW FULL ANALYSIS VISIT - FXOpen Blog...
Disclaimer: This forecast represents FXOpen Companies opinion only, it should not be construed as an offer, invitation or recommendation in respect to FXOpen Companies products and services or as financial advice.
Attached Image (click to enlarge)
Gold price started a fresh decline below the $1,785 support zone. Crude oil price struggling near $78 and might correct gains in the near term.
Important Takeaways for Gold and Oil
- Gold price faced resistance near $1,825 and corrected lower against the US Dollar.
- There was a break below a key bullish trend line with support near $1,798 on the hourly chart of gold.
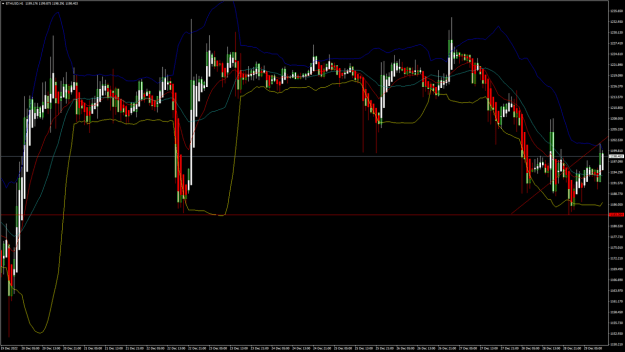
- Crude oil price gained bullish momentum above the $72.00 resistance zone.
- There is a major bullish trend line forming with support near $76.10 on the hourly chart of XTI/USD.
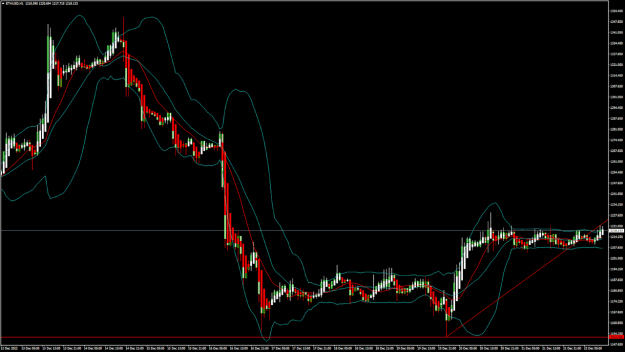
Gold Price Technical Analysis
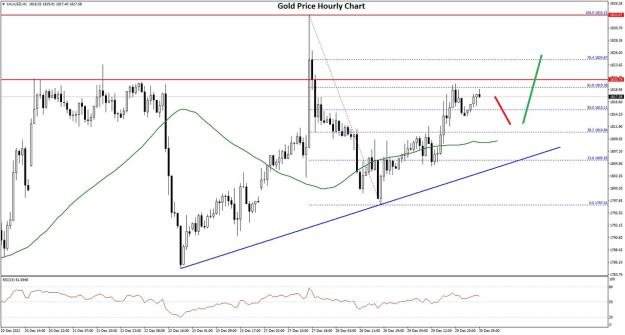
Gold price traded high above the $1,810 resistance zone against the US Dollar. The price even cleared the $1,820 level, but the bears were active near the $1,825 zone.
A high was formed near $1,824 and the price started a fresh decline. There was a clear move below the $1,810 and $1,800 support levels. Besides, there was a break below a key bullish trend line with support near $1,798 on the hourly chart of gold.
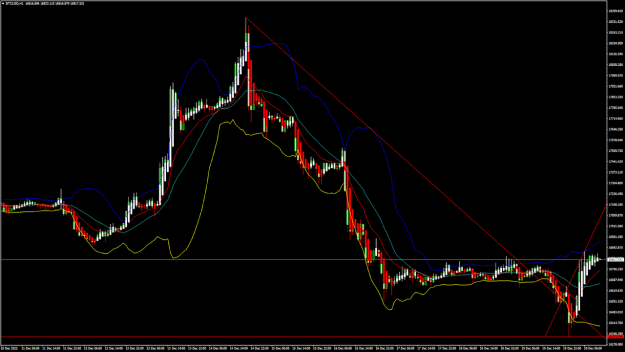
Gold Price Hourly Chart
Attached Image (click to enlarge)
The price settled below the $1,785 level and the 50 hourly simple moving average. It traded as low as $1,773 on FXOpen and is currently consolidating losses. On the upside, the first major resistance is near the $1,785 level.
The 23.6% Fib retracement level of the downward move from the $1,824 swing high to $1,773 swing low is also near the $1,785 level. The main resistance is now forming near the $1,800 level and the 50 hourly simple moving average.
The 50% Fib retracement level of the downward move from the $1,824 swing high to $1,773 swing low is also near the $1,800 level, above which it could even test $1,820. A clear upside break above the $1,820 resistance could send the price towards $1,840.
An immediate support on the downside is near the $1,772 level. The next major support is near the $1,760 level, below which there is a risk of a larger decline. In the stated case, the price could decline sharply towards the $1,750 support zone.
VIEW FULL ANALYSIS VISIT - FXOpen Blog...
Disclaimer: This forecast represents FXOpen Companies opinion only, it should not be construed as an offer, invitation or recommendation in respect to FXOpen Companies products and services or as financial advice.
FXOpen - International True ECN Broker