As the year draws to a close it's probably a good time to do some housekeeping. I've tidied up my systems folder and am shocked to see how much it's expanded. I'm basically too divergent, too creative, and not focused enough. It's a problem I've known about for a while, possibly a symptom of some latent and undiagnosed ADHD? Anwyay, I've developed so many systems that I'll never be able to test them all without a large team.
Working with Kefada has been extremely enlightening. He's very easy to work with and does great work. I've been able to test out theories far faster than I could by simply backtesting / forward testing like in the old days. However it's becoming costly and the breakthroughs have not happened as I had hoped. Basically it seems to be reinforcing what I had feared which is that the market moves at a certain pace. Trying to overoptimize or force your hand simply makes you a vulnerable target, and so getting your 25-30% per annum is about what you can expect from automated trading, at least while staying safe. This means if there is anything more profitable or impressive it probably doesn't come about with an algorithmic system, or at least not one that can be built with a small team. What's needed is a dedicated company with a group of engineers if we aim to endow any EA with some of the sensibilities of a human, and all the consistency and alertness, and unhesitating reaction speed of a computer.
Until I assemble that team it's probably a good idea to assess what my beliefs are now, and then split up those systems into 2 piles.
What is worthy of future research, if/when resources become available and
what should be archived and left behind probably forever, because it no longer aligns with my beliefs?
Ok, so what do I believe? Most of it lines up with the conclusions already drawn from the book club. Some spoilers for current books follow. Beliefs
Technical analysis, even cyclical analysis, is a dead end. Cycles especially are seductive because they are inconsistently rewarding. Almost addictive. However they just get run over by pragmatic concerns and news.
Momentum is real, but it's also a bit weaker than I expected. Again, it fits in with the idea that what is noticeable must be brought back in line. What is worth researching is whether Niederhoffer's original idea still holds. I tended to focus just on momentum and not on the trend-creates-trend and reversal-creates-reversal notion. It may also be cyclical and influenced by interest rates, so its importance may change over time.
Money management; so much easier to just automate it. Algo trading or at least an automated trade manager is probably always going to be part of how I work.
Price is cyclical, but ergodically, and it's mainly a function of mean reversion.
Mean reversion is very very real. It's probably the most important consideration in any future system. Forget about 38.2 or 61.8 it's 75%.
Mind Games. The market's a jungle and you're crazy if you're not paranoid. Expect the fakeout. You can almost depend on it. Expect your stop to get hunted. Copper the public's bets. Make every effort to go unnoticed.
There is a curious, and I'm convinced, unnatural balance between the Wyckoffian ranges and the profits that can be realistically earned in a trend. This could actually be predictive if we had a way to measure the potential/probable past flows.
Price action is mostly Brownian motion, of some type (Ornstein-Uhlenbeck?) it hardly matters which, and is boundedly random. Random enough to create confusion and foil the most clever quantitative systems but just motivated enough to confound any system that depends on randomness, and to ensure the most retail stops get harvested. Price is fractal on every scale, but this doesn't do anything for prediction.
Price has 4 tendencies - limiting/conglomerative that forms channels; extending/dispersive that causes trends along a discriminant; cyclicality with amplitudes governed by a power law; fundamental motion reflected in the long-term price, based on the most basic and stereotypical assumptions.
The market as a whole is reflexive/reactive not deterministic; not a natural phenomena. It is a game played between players and the character of 'Mr. Market' isn't as emotionally unstable as we've been led to believe. He is in fact a deadly assassin who plays dumb from time to time.
Mean-reverting south of H1 and trending north of H1.
Re-entries > Exits > Entries because redundancy is key to overcoming noisy signals.
Ok, so what's in store for the future?
Organize the systems and pick a few targets for future projects. I can use this thread to help me sort out my thinking.
Switch focus away from developing EAs and see what's possible with (possibly) improved discretion or at least less automated, more hands-on EA trading.
I'm inspired by the good work that Joyny is doing and maybe it's time to set up a Darwinex or two. I'm still a bit hesitant though, because this violates the repeated admonition to keep quiet. At the same time I wouldn't mind a few investors.
This is going to be a review of my FX experience starting from the summer of 2016. I had decided there must be a better way to make money than by dealing with clients. Today, I'm pretty sure there is.
I don't have exact creation dates for all the early systems but I'll try to go in chronological order as much as my failing memory permits.
When I got started I had no mentor, no guidance apart from what I could find on the internet, and no clue. I was a classic patsy.
I started off with stocks. I read sites like Stockbee.com. His system seemed random to me, and had a dissatisfactory low win rate for a newcomer to trading. Eventually I gravitated to Forex, probably as a result of ad campaigns that came up around the time of Brexit. I was right about Britain leaving the union and managed to make a few hundred dollars, which I quickly lost back and then much much more.
I got started by reading forums, this one, and Steve Hopwood's (shudder). I signed up for a social trading account (double shudder) with Tradeo (triple shudder). I was doomed from the start.
I tried following systems like 'Choros: The Dance' but found them annoyingly subjective and with fairly random results. I also realised most of the 'experts' in forums are just looking for guidance themselves or worse, are there to mislead others. The most confident are usually the worst. 'Nobody knows anything for sure' is still a core part of my philosophy. Don't trust anything you hear at face value; test it all out for yourself.
The first time I started to look at charts on my own was probably less than a year after I got serious about becoming a trader.
The name came from my realization, that what I was doing was uncertain at best. I couldn't explain how this was going to work so why should I think it would work? Because it seemed to work for a few months in the past. That's often the way things start, but I now know that's not where they should be left.
This was a trend-following system that traded on gold charts, for the only specific reason that gold seemed to be trendy at the time I was looking.
Attached Image (click to enlarge)
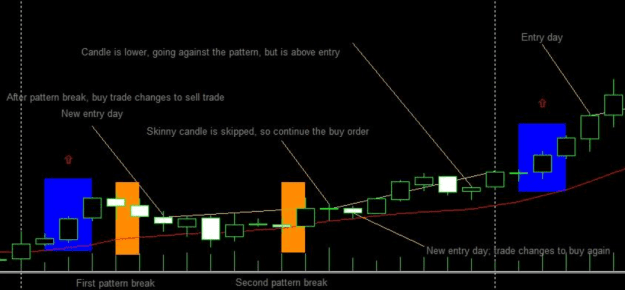
The basic idea was to wait for a trending pattern of a few daily bars and then hold the trade for a whole month and then exit. Of course this is doomed to failure any time price creates a 'hill' shape and it gets brutally disrupted by ranging periods. I thought I had seen a 2-bar shift at the start of the month that could be explained by the way charting programs tend to obscure the first day of the month with a period separator. That seems silly now.
Good: holding trades for a long period, reducing costs; checking the charts only on a daily basis. How did I have so much confidence in myself? Because I didn't yet know that I'm an inveterate tinkerer. Trading with a low enough volume to be able to withstand even monthly volatility spikes. Bad: attributing importance to candlestick patterns of any type; allowing signal changes after a trivial event, "if the body of the candle (shadows don’t matter) is lower than the body of the candle on entry day" ; expecting a small amount of data (3/20 days) to signal the direction for the remaining 17; assuming that monthly periods have any inherent structure; not taking into account the maturity of a trend before entering; not measuring trends in relation to anything else. "The alignment of monthly trend shifts has to be more than coincidence." False.
"We could try to take profits more often, daily or weekly, but then our returns would go down. The reason for this is that the more frequently you trade, the more often you put yourself at risk and the greater the risk of error/countertrends. The further down the timescale you go, the noisier the patterns get, the less reliable the data gets." Still an open question.
Later versions added such refinements as a SL; a TP, measuring the ATR and using a chandelier exit; waiting for more than 3 days (6/30); using a lower timeframe like M30 and exiting daily; using an MA to check for ranging periods. Tried MACD, PSAR, All for nought.
Another good thing I did was write a post-mortem after I had abandoned it. I should have kept up that habit. "I think we might be right back to the drawing board. Can’t get it to work on the 5min. Can’t get it to work on EURUSD on higher timeframes, like D1. It seems like it works well enough on GOLD maybe because gold takes longer to complete a ‘streak’ or trend, but that in itself doesn’t make my indicators any good. Maybe combining PSAR with MACD is just not a good combo. I need to learn some new ways."
Learnings:
Being 'lazy' and following a trend to its logical conclusion, seems like it should be a simple matter, but it rarely is. At some point you have to define a 'line in the sand' beyond which price cannot be allowed to retrace.
Adding things to a system that isn't working is usually the worst way to fix it. Especially adding indicators. Indicators show you what has already happened. They detect when something is visible. Indicators that can anticipate something (with the exception of oscillators) might have limited usefulness.
Patterns of any kind, are not going to hold up. They are too obvious.
If you have the wherewithal, getting a simple EA made to test out (simple) ideas is usually faster than trying to hand-check anything.
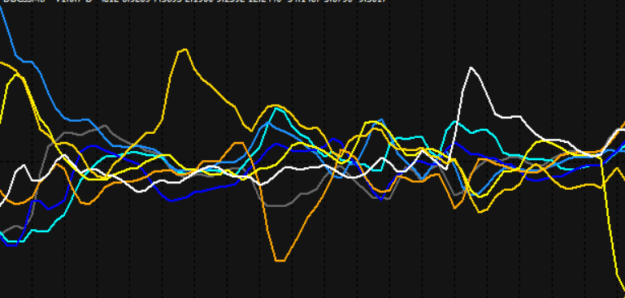
This system idea was inspired by the Steve Hopwood forums. One of their favorite pet indicators was (probably still is) the CSS (Currency Strength and Slope). It's a rational-sounding idea. A currency has a certain strength, it rises and falls over time. They rise and fall in relation to each other, and we can use an indicator to show whether a currency is currently rising or falling.
The trouble is that just like security prices, a rising price can fall at any moment. A currency strength can weaken at any time, not necessarily at the peak of an arc or an oscillator range. I never found anything more than random performance from the CSS.
Attached Image (click to enlarge)
Whenever I see a bunch of wiggly spaghetti like this I think that's not much upon which to build a solid foundation.
The HGI was even worse. I don't recall what it stood for (something silly I think?) oh, "Holy Grail Indicator" which it was not.
From the creator's description it is meant to:
1. Tell you when something has started.
2. Tell you when something has ended.
3. Tell you something will continue
4. Tell you something will not continue
5. Tell you when to enter a trade.
6. Tell you when to get out of a trade.
7. Tell you where to put SL
8. Tell you when to reenter or multi-level a trade.
It did place reassuring arrows on a chart but it did nothing much different from any other indicator. It assumed that what had happened would continue to happen until it stopped.
My idea, which I'm ashamed to say I've tried many times since and probably won't stop trying (but should), is to take two dodgy inventions and jam them together hoping for magic.
This is the bit that encouraged me to try it:
"I have run the CSS with 16.08 this week on a cent account, for the first time in several years I have been able to trade for a full week, minus domestic chores and house repairs, being a taxi etc.
I have used your suggestion Bob of D1 and enter on Big Arrows on M15, after a closer look at CSS on H1 and the news, I have Steve's MPTM placing SL and TP then adjusting manually related to ATR levels. "
And this is from my notes: So use CSS (currently 10.7 v3.8 what ever that means) I think this is the latest. Use HGI (currently using v.17.00 - think that’s the latest) Check the currency pairs at the start of each session using the D1 timeframe Pair strong and rising with weak and falling. Enter on the 15M at big arrows (trend) trades. Ignore RAD and range arrows for now.
Impatient rebel that I am, I didn't even use it on D1 to attempt to mimic the OP's success.
Good: Trying new things Bad: Everything else. One indicator will not produce good results and two indicators will not do more than filter out some weaker signals. You might try using multiple indicators together to find a 'confluence' but it's really only going to show you the most obvious signals, which are probably better for fading than anything else, as they will consist of the moves most clearly seen by the public.
Learned:
If you don't understand the principle behind an indicator, if you can't explain the rationale behind why it might work, it's best to avoid it.
What if you take a band, like a Bollinger band, and trade the bounces off both sides?
This idea I nicknamed 'space folder' and it became a whole family of systems and launched a love affair with band indicators. I still am quite fond of bands, but have fallen out of love with the Bollinger variety.
It's interesting to me that I also started off from the very beginning with a notion that an opposing pending order could take the place of a stop loss. It has been an idea that I've abandoned and returned to a few times.
The rules for the first version are unusually compact. I can put the whole thing here.
Space Folder
Chart: Any - trying EURUSD Timeframe - Any - trying M15
Indicators - ATRx2; one at 5 periods, one at 14 Bollinger bands x3 at 1, 2, and 3 standard deviations
Entry: ATR is uptrending on both 5 and 14 after a dip. So basically ATR is reversing up. Use AATR (average of 5 and 14 ATRs) to measure vertical distance for a straddle of stop orders (one buy, one sell).
Exit: Set trailing stop after you reach one AATR - readjust this value every candle. Set trailing stop once you cross upper/lower bounds of 2nd or 3rd deviation bollinger. Enter new trade on next candle open, if 5 and 14 period ATR are still rising. Not flat. Rising. Else, wait for them to agree, and enter on following candle.
Stoploss: No need to use stoploss for risk management. Go ahead and let the other stop order get executed if price moves against. Set virtual stop loss once 50% favorable direction achieved?
Folding: If both stop orders get hit, hold them until one direction has a clear trend. Bollinger bands can be a clue. For ex. If candles close on one side of the 2 or 3 std. Deviation bounds 2-3x in a row. That side is the trend-side. Close the other side of the order. Exit when price moves 1 AATR as a solo act.
I abandoned this because I didn't like how many losess it generated. However if you had a notion that price would be stationary for a time, or you traded it only during dull market periods..?
Future updates removed the 2nd ATR indicator. Steve Connell says to use 'standard technique' when the ATR is <50 but straddle when it's >50 but my own studies contradict this. "During trends, there is more bouncing between bollinger tops and bottoms than in ranges where it often just floats up or down over time. In which case you’re better off making a single trade and holding in the direction of the middle band (if there is any direction)." That's likely one reason I abandoned the Bollinger. Too 'loopy' at the extremities.
The win rate by straddling is good but you can wipe out days of profit by catching a sudden trend without a SL. Also the ATR can vary quite a bit over time and what began as a reasonable R:R becomes unwieldy.
Other ideas included adding envelopes, moving the SL after the trade is in profit. Eventually it morphed into something I called Nyan Cat, which I'll describe separately. Good: takes advantage of mean reversion which is solidly reliable; straddling could improve win rate Bad: susceptible to volatility; hedging is game that may be unwinnable; when using multiple bands it gets complex fast; your trade affects the outcome, so expecting victory within the space of a band might be too optimistic
(click to play gif)
The name fits in two ways. Movement is like Nyan Cat (zipping up and down), and it’s absurdly simple, possibly even silly.
Chart: Any, maybe even gold. Timeframe: Robot - any, manual, probably only 15m and up. Indicator: Anything that predicts when a trend starts and finishes. You could use MACD, RSI
Entry: When price moves ¼ ATR enter in the same direction. Exit When the trend reverses, close all open trades, and start entering in the reverse direction.
So it’s a bit like Dottybot (maybe exactly?) except it only takes one side of the market at a time (does DB?) Max no. open trades: not set yet (so zero). It can actually take some time to manually close this many trades so maybe find a ‘close all trade script’ that will make this easier. Other ideas: Set up a field of pending orders (only one direction) that can be opened as price moves so that in the even of a fast move you don’t get big gaps in entry. Use a straddle entry at the start of every trend to ensure you don’t get caught flat-footed?
Good: simple to code Bad: much like anything else this simple, it works until it doesn't and then you have no plan for how to recover. What usually ends up happening is, if you're lucky, and there is a motivated trend right when you enter, you make some good profits, but then at the first retrace, you'll have left behind some trades (stragglers) and if you don't close these within a reasonable time you lose everything you made. If you play both sides of the entry with a straddle price will meander along that divide activating both sides and creating a bank of buy orders at the top and a bank of sell orders at the bottom. This is a classic problem.
Despite that, I'd guess about 10-20% of all EAs for sale on the MQL market use some logic about as sophisticated as this. Open some orders, wait for them to go into profit, no matter how long it takes, even to the point of account death.
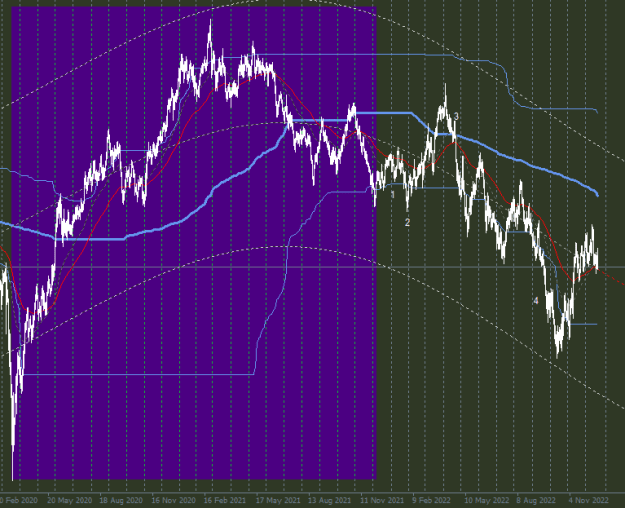
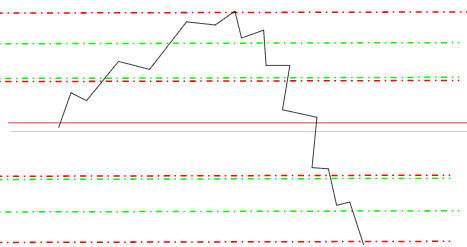
{image}AUD is either going to chop sideways for a time, possibly bouncing up into the channel or it's going to continue to drop with USD strength. Does that help me make an accurate forecast?
Ignored
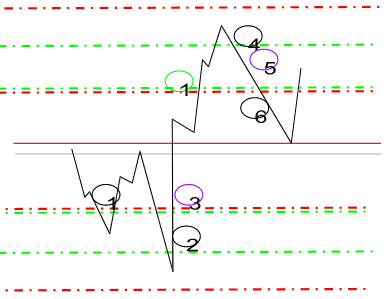
Revisiting this after nearly a year later.
Curiously, it did all the things I said it could do!
Attached Image (click to enlarge)
The history we see in the original screencap is highlighted. The new history begins after the purple rectangle.
1. It began by chopping sideways, somewhat respecting the band edge.
2. After making a new fakeout low,
3. it broke back up into the channel, first bouncing off the equilibrium point (pivot) and then grinding up higher to confound all the new short-sellers.
4. Then it declined with USD strength over the long term.
This is just a coincidence of course, both in the sequence and the end results. OR IS IT??
This shadowy ranger is supposed to make band profits. In ranges. Ranger that he is. Range-er. Aragorn. Strider? Get it? No??
Chart: EURUSD Timeframe: 5M
Indicators:
Tipu MACD (12, 26, 9)
FFx Bolling Bands (?)
Tipu Trend (?)
Entry:
When the price crosses outside the walls of the bands, place a straddle above and below.
Usually the price will break back towards the pivot center (central line)
If it breaks away from the bands, that’s probably a break out (or a trend)
Either way, once a trade has been triggered cancel the other trade if you have time
Exit:
If it’s trading inside the range place your t/p at the pivot center
If it’s breaking out, put a stop-loss at the band wall, and trail it once you feel the breakout has lost momentum. You’ll likely want to place a reverse trade back towards the pivot center.
Position size: 2%
No. of simultaneous positions: 2 MAX
Notes:
The center pivot line is dynamic so you may need to adjust your tp every so often
Same with the s/l as the band walls will move
Later versions checked for news; determined a dominant trend using the band midline direction; required a band bounce; waited for a bar break before entering; using signal and confirming candles; double tap entry; added trailing stops; waiting for ATR uptrend (no effect); discretion like exiting if the trend starts faltering, if the trade has cleared the spread; checking higher TF to determine the trend; checking correlations; and of course the filter length for the bands changes a hundred things.
On paper it looks great, but in practice it hardly won as you can only really profit by being on-side with the trend; the straddle only invites trouble. But why? It should work. This is just about as simple an idea as it gets, and is basically the bi-directional version of Cosmic Tennis (TBD) or a banded version of Nyan Cat. Good: simple band mean-reversion strategy Bad: cannot handle the chaos of real life trading, although my expectations at the time of invention may have been too high.
It's important to notice:
1. This particular version is only meant to trade in towards the midline. Or out to become a trend trade. You could eliminate all trend trading and only take the 1/2 band fluctuations. Then you'll likely get burned by trends.
2. There is no trading from the midline out to the band edge. However that's something else you can try.
3. There is no edge-to-edge trading; that's a different system.
Sadly I did not keep testing results for this. Or did I? No. I have this comment on one version. "This seems to be about random success and profitability - same problem as the others."
This is a major shortcoming in my methodology as recording results both successful and failed is critical to knowing what has been done and WHY things failed. It's an important part of 'reciprocal thinking'. What I recall is that you'd place a straddle and then one side would get hit inside the bands and cleanly move away to become a trend. Then move back when the higher volume trend trade was triggered. And this could run on ad infinitum creating a mess. If you use tight stops they just get run roughshod.
One obvious solution is to widen the straddle bands so that they encompass the band's midline/pivot. Did you ever think of that? No, you only think about yourself. Then you're trading out from the midline, and in from the band edge. This could require an extra trade if price begins trending.
Well, what do you do when you lose everything (testing results)? You just start again. You start all over again.
Chart: Any Timeframe: Any Indicators: Third deviation Bollinger set to 20; ATR channel breakout set to body - 20 period
Enter long when price crosses above centerline; short if it crosses below. Exit on any candle close that generates a new signal. Also exit at 3rd band boundary. Exit when price closes on the wrong side of centerline. (oof)
I assume this means starting from an origin point outside the bands? Otherwise if you exit every candle that closes on the other side of the midline you will get chopped to pieces. But you will get chopped to pieces anyway with that third rule. Get rid of that.
I also added rules about adding to the position using a larger order (breakout) and smaller one (reversal) that get placed regularly on each new signal of the ATR channel indicator. The idea is that if price reverses, which is more likely because most breakouts fail, then you close the breakout trades, and the distance travelled will be smaller than the reversal trades coming back to the midline. I wasn't sure if the trade sizes should be switched.
"Real reversals usually start early after candle formation, and don’t hesitate or fake back much". Honestly can't say I put too much stock in this now.
Variations include not waiting for a centerline cross but on any signal that originates in the proper half. Exit on any signal (the ATR channel breakout indicator) closer to the boundary.
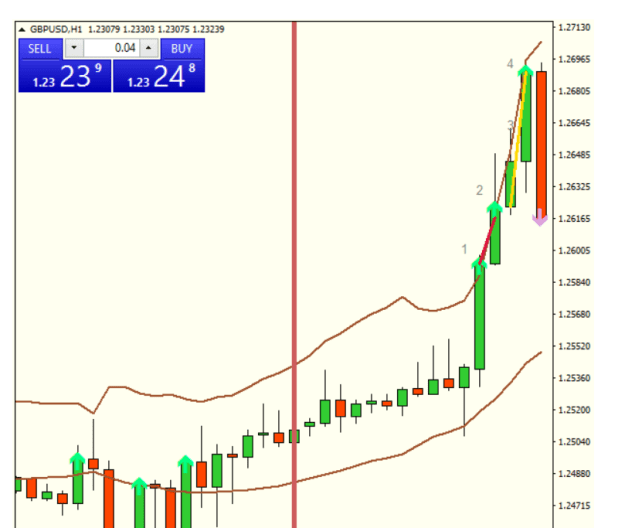
Luckily there is a diagram.
Attached Image (click to enlarge)
0. (not shown) enter on price crossing midline. Origin was the bottom band. 1. Price hits the boundary. Signal generated. Exit for profit. Now enter 5 units long and 1 unit short. 2. Another boundary hit. Another profit banked (close 5 winning and 1 losing). Another 5:1 straddle. 3. Another profitable close, but no ATR signal this time. So enter no new trades. 4. New high, signal, close 5 win, 1 loss; enter another 5:1 straddle. 5. Reversal! When do we call it? I said >75% of prior candle height; experience tells me that will get you in trouble. Close the breakout order. Keep the reversal order. Close the reversal order at the bearish ATR signal.
My notes advise discretion in exiting; with a bias towards exiting the big trade early, and holding the smaller reversal trade. You could of course try holding all the long trades for a big jackpot. Except in the most tremendous frenzied volatile times you will likely regret it.
As long as we're being discretionary check out all these other factors you can consider for adding to position size:
Price is trending
Bands are wide open
Trade direction is dominant
There is a wall-climbing possibility
A new market type is starting
Support or resistance is favorable
Gaps
Prelim testing might show that it’s better to weight trades near the boundaries higher, and trades just crossing the centerline, lower?
Deduct from position when:
Price is ranging
Bands are narrow or narrowing
Trade is counter-trend
Market channel is very well defined and mature
Major support or resistance level is coming up that would affect the trade
Red news is coming up (maybe avoid trading altogether)
Signs of confusion exist (dojis, double-headed signals,
Exits:
Any favorable trade at a new signal appearance.
Any favorable trade that crosses the 3rd deviation boundary of the bollinger
Any favorable trade that is starting to show signs of trouble - spiny backs, dojis, declining trend, hammers, falling stars
Any trade that closes on the wrong side of the centerline. If trading manually you can use discretion here.
In a narrow range it might be worth not taking more than one trade in any direction?
Re-entry:
Wait for price to cross the centerline again, or start wall-climbing again (variation: wait for another favorable ATR signal)
Use 2 trades in opposite directions, one big trade that favors the breakout direction, one small trade the favours the reversal direction, when riding a wall-climbing trend
After a successful end-to-end, even if price didn’t end up hitting the 3rd dev. Boundary, do a reversal trade because it has a good chance of succeeding?
If trade was exited after a positive signal, but it hasn’t retraced back across the centerline, make a smaller position size trade in case trend continues. Use signal candle low (open?) as stop-loss.
Use trendlines to gauge the likelihood of a trend continuation.
My goodness, how are you going to test all those options? My notes advise using a checklist. Good: nothing? At least not for a mechanical system. This could be someone's discretionary holy grail after years of training. How would I know? Bad: complexity without evidence for its necessity. No allowance for ranging trading conditions or how to avoid them.
A suitably festive themed trading system that I abandoned and then somewhat unconsciously came back to in later years.
At some point I noticed that price wanders around somewhat crazily. It goes hither and thither like a mouse stirring about a house on Christmas eve. Why not try to capture some of all this apparently unmotivated Brownian motion?
The problem is, as we saw with the band systems, a trend can come along and sweep us away while we're enjoying our bi-directional profits. So, the solution is to put some kind of 'governor' at either end of the ranged setup.
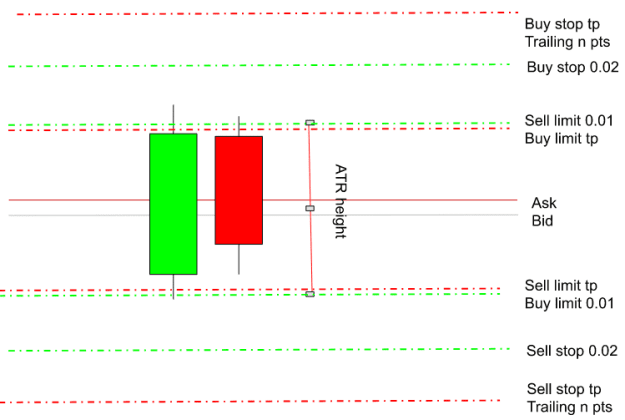
So we set up a heavily modified grid.
Attached Image (click to enlarge)
A pair of limit orders with take profit levels set at a certain distance away, 1 ATR here. The inner limit trades catch profits (which I call cratchits) when price moves up and down the range. The stop orders, at higher volume, if they get triggered due to a sudden trend, should net a generous enough profit to clear any losing cratchit trades.
Attached Image (click to enlarge)
Looks something like that.
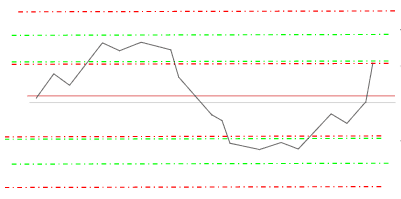
But if price is volatile and hits a few levels you might get something like this.
Attached Image (click to enlarge)
It generates a profitable stop trade, a cratchit and another profitable stop trade at the cost of a single losing cratchit. I call this a Blitzen. I gave all the possible price movement patterns cute names based on either the Dickens book or the movies.
As a final genius twist I decided that if no trades are entered by the close of a bar the whole grid should get up and move so that it's always centred on the bid/ask. The jury is out on whether that's a useful innovation. Another variation is to move only the limit trades every new candle.
So what's the problem?
There are at least a few common patterns that can scupper this. For one thing, if price triggers a stop trade and then comes back, triggers the other stop trade, you've got an unavoidable loss. You could try adding more stop pending levels at prices above and below the price at this point but then it suffers from some paradox of infinite regress. Eventually price has to trend but if it doesn't do it quickly, but leaks out slowly, this could trigger a lot of opposing trades.
Another issue is that price doesn't have to do anything very atypical to get complicated.
Attached Image (click to enlarge)
Trading this manually is not recommended.
And then if price simply sweeps grandly from one end to the other, the stop trade profits have to be taken far enough away to close all the dead weight or else allow the cratchit trade to run as a loss. And if you do put the stop tp far enough away it gives price lots of chances to revert and cause more trouble.
Good: thinking outside the usual grid trading box, at least a bit. Bad: complex, hard to trade manually, probably trying too hard to avoid taking an honest loss.
Based on these difficulties I put this aside and started working more diligently on the space ranger/space folder systems. I may not have given this the attention it deserved.
Rationale: "The major drawback with holiday trading is that there aren't enough holidays!" says Martin Zweig, in the book Winning on Wall Street, published in 1986. A 146.3% annualized return - that's what you'd have made following Martin Zweig's New Year's Eve trading strategy and you would have done it for 33 straight years... In his book, Winning on Wall Street, Zweig tested the trading patterns surrounding the holidays. The last trading day of the year, usually New Year's Eve, seemed to defy statistical explanation. In the 33 years ended in 1984, Martin Zweig reports that stocks fell on the last trading day of the year in only one of those years - making the New Year's Eve bet practically a sure thing. A similar phenomenon occurred around other holidays, too, with even better returns in some cases (the day before Labor Day and the day after Thanksgiving).” Basically people are in better moods before a holiday, and better moods means more optimism, and more optimism means buying.
This pattern got weaker to the point of disappearing in the late 1990s and early 2000s because it became too well known, and because algo trading started to dominate. However, the pattern still exists, especially in foreign markets where Zweig’s theories are less well known.
Is that what we think now? They’re less well known? Or is this a typical case of thinking what happened in the past will repeat in the future? Also how is anyone supposed to make money trading a few times a year without a giant bankroll?
Entry & Exit: Buy at the day’s open and sell at the day’s close. Only on national holidays related to the country/currency/exchange pairing. Use an FX calendar to get holidays. Requirements: a broker that lets you trade stock indices CFDs.
[insert backtest] Never done!
Update: Did New year's day and it's a bust (even split up and down days over the past dozen years). What about the December Xmas season? Also not apparent.
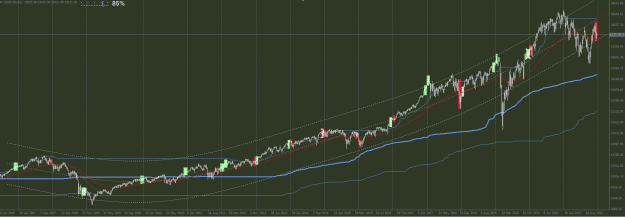
Attached Image (click to enlarge)
There does seem to be a bullish bias in December but that's pretty much what you'd expect for an instrument that has a perennial bullish bias. Moving this to the 'dubious' pile.
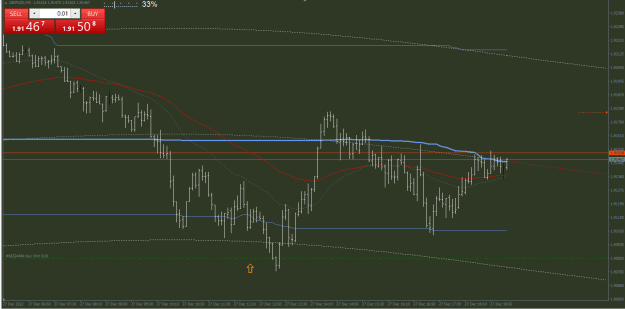
I placed an exploratory buy limit at the level shown at
Attached Image (click to enlarge)
the time shown and when price clearly breached it either the order was rejected (without alert or error) or the spread was widened in order to not trigger it, a criminal act by my broker and a sure sign that price will continue to rise in this pair.
My loss is your gain.
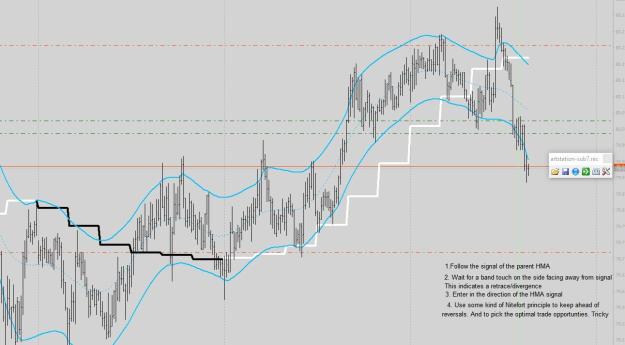
Bandrunner 1 was just the observation that you should try to wait for price to make contact with a band edge when there is plenty of 'room to run' to the other side of a band, of course I overcomplicated this and turned it into a few paragraphs. Still, not really a system and more of a good habit, or a method.
This is a system.
Try this idea with Hull MA and bands (update: I have-see below) - I have developed the template and a scan list for it. On H4
Indis:
Hull Master 34
HMA period: 24
Price: 0
HMA speed: 2.2
Lines: false (they really don’t seem to show any support/resistance area, which is odd, or maybe not.
Heiken Aishi candle count alert
Adjust alerts as needed
Target bands
Half-length: 24
Price: 6
Deviations: 2.5
Interpolate: true
Chaos Visual Averages
First WPR smoothing: 12
First smoothing: HMA
First WPR: 24
First Up and down levels: 30/-30
Second WPR smoothing: 96
Second smoothing method: HMA
Second WPR 192
Second up/down levels: 40/-40
Double smoothed: false
Overkill? It still looks fairly tidy to me.
Oh my goodness, no. This is overkill. This many signals will cause you to delay correct entry and fall victim to Ehlers' 'Spectral Dilation'. It's definitely a spectre, and definitely causes dilatory behaviour.
This ended up becoming something closer to the Early Warning Detection System (EWDS) (I’m calling it ‘guttersnipe’) but here is another template of BandRunner that’s a little cleaner. Now if I could just Nitefort it in a logical way.
Attached Image (click to enlarge)
Don’t forget that target bands are a little bit deceptive as they bend with trends; it might not be possible to avoid entries that are too early/late after a band touch.
TMA bands are deceptive, as they recalculate. I found something better. However this system didn't work nearly as often as it seems it should, for reasons that will be deemed paranoia, except that I have documented proof, as I do this morning, for example, of limit orders not being triggered, especially in the case when they are likely to be profitable.
For that reason I prefer to be bidirectional and win at whatever price my criminal broker will deign to give me. Although this system combines two real tendencies, mean reversion and overall trend, it seemed to fail at just the time when I showed sufficient interest. Perhaps I needed to set my bands wider, and lengthen the period of my HMA. Perhaps I needed to trade only in the longer-term trend direction, and ignore countertrend moves. Perhaps.
The key is to allow the long trends to play out. So you will often get deep retraces but they should occur only after the position is in profit. The position should become profitable fairly quickly. Exit the trade early if it isn’t behaving as expected. Don’t get shaken out of a long trend by noise on H1 or on temporary signals from H4. Wait for candle closing to confirm signals. Entry:
Trade only in the direction of the H4 stochastic. First entry should only be when both lines cross above 80 (overbought or OB) or below 20 (oversold or OS). Long trades only when OS, short trades only when OB. Subsequent entries can be in the middle but trade with smaller lots.
Wait for candle color change on H4.***
Wait for a confirming signal from H1 and confirming candle color change. Enter in the signal direction.
Exit:
Exit on hitting stop loss or
On candle colour change (closing) on H4. OR stoch signal on H4 that persists after closing.
Exit in the early stages of a trade if it just sits there or drifts away. The series of confirms should mean the position gets profitable quickly and so if it doesn’t there’s a problem.
MM:I’m using 0.1 lot per $1k dollop. Since I”m testing on only one instrument on a 3k account that’s 0.3 per trade. Never heavier than this, and lighter when setups are not perfect. Stops: Set safety (virtual) stops under the previous swing high/low. Divergence:Make note of divergence especially on H4. Prepare to exit or enter when a divergence opportunity is spotted but wait for the confirmations. Ignore: Apart from the entry signals you should ignore:
Stoch signals on H1. They will chop you up.
Candle color changes on H1. They will chop you up.
Long signals in OB zone and short signals in OS zone on H1 or H4
Exit based on H4 signals.
Here's the thing. All this system does is 'buy the dip' in a trend. Thousands of similar systems use the same notion. Price is temporarily out of line with the larger trend because of a random(?) fluctuation, it's probably a good time to get in when the trend resumes. Trends are real. This method by itself is one of the things that works, and is valuable to recognize.
What isn't real?
Divergence/Hidden divergence. I mean, they exist but they predict nothing. In fact, they are probably better for 'coppering the public'.
If the trend is real why get out of it after an hour?
The stochastic indicator is like anything else, it only shows you what happened. OB/OS is primitive compared to what you can figure out by other means.
If you're not going to automate this then there are dozens or hundreds of notes that we could add about improving and filtering entries and exits. Most of this is internalized by repeated practice, not something you can get much benefit from.
As a result most traders naturally modify something like this to suit their temperaments and abilities until it becomes something else entirely. This is why it's so hard to keep system threads on topic.
Notice the thread has been dead for more than 2 years.
One of the last proponents, MelloYello; Is he still active on FF? Yes. Does he still trade it? Well, if he does he no longer posts about it.
Most FF threads end this way. It means either
the author got tired of the attention he got;
the system reverted to the mean and people abandoned it,
or they're still quietly trading it. It's earning 10-30% per annum.
Better to layer into positions then to jump in with all feet right away. Better to add to positions when price is clearly trending and avoid adding when price is ranging.
Discipline yourself- enter and exit only on the candle color change of the H1 when trading with dominant trend, and H4 when trading against.
If you’re trading heavy cut losers fast, and take profits if uncertainty grows. If trading light just trust in the trend.
The best time to enter may not actually be when stoch lines cross but when they’ve been hovering in one zone or the other for a while(2-3 peaks/troughs?) (ranging) and then give a valid signal followed by crossing strongly into the middle zone. In other words, the second, third or fourth valid signals may be more reliable than the first, and the best time to enter isn’t while stoch is in the endzone. There is rarely just one signal before a significant move, even on H4. That’s why we wait for the candle color change that persists to closing.
I shall make a duchess of this draggle-tailed guttersnipe. -Prof. Higgins - Pygmalion
Being a combination of One Hour Sniper and Reverse Underhill (underhill with reverse EMA which I never got around to documenting). This unruly ruffian tries to throw as much weight above and below the local ranges (like O/U) but waits for confirmation from a moving average (Hull MA or HMA) and stochastic signals (like OHS) and gets the best entry/exit times from Reverse EMA (like Reverse Underhill). From Bressert DSS?
This system trades local minima/maxima. It probably doesn’t hurt to check higher TF on the phone once in a while to get perspective. BUT don’t trade the higher TF on a smaller account as this can strain your margin. You need to (try to) stay within the ‘home bands’ (explained below) and for now these are going to be H1 (orange-red) (for bases) and H4 (orange) (for stations).
'Bases' and 'stations' are ideas from a different system that I should probably put here first, but I can't immediately lay hands on it. Forthcoming. The idea of a 'home band' is interesting and probably a reflection of someone who doesn't understand the very high variance of price.
-Set nth consecutive same bar to 1 I also ‘turn off’ the standard candles by setting their colors to the same color as my background, leaving only the Heiken Aishi candles visible on chart.
Chaos Visual averages 1.43
Target Bands
Hull Master 34
Settings are different for all instruments. I had specific ones for gold, but again, they won't be the same in any regime, so pointless to copy here. Besides, once you put this many indicators on one chart you are lost. Too many degrees of freedom. It would be a while before I recovered from this particular sickness that afflicts many traders, some veterans even.
Principles:
The trend is your boss.
For base trades: If the M15 bands centerline (moving average) is sloping up, stay long, if down, stay short.
For station trades: If the H1 bands are sloping up, stay long, if down, stay short.
The only time to trade both ways is if the bands are basically flat (in a range).
Entry:
Use straddles even when it seems unnecessary. There is no added risk, and it might prevent some fakeout losses.
enter on band touch AND ⅔ (⅓?) of:
stoch signal and/or
chaos signal (leaving base/station) and/or
Bressert state change
First entry is the anchor. Don’t pull up the anchor until the slope has changed, preferably on H1/H4. BE SURE.
An anchor is just a trade that you want to run longer-term.
Exit: only on a contrary Heiken Aishi candle OR a band break
Wait for slope to change on M15 (base trades) or H1 (station trades) and/or
Wait for signal from stoch, chaos, bressert
Ignore/be skeptical of:
Signals that occur far from a containing band
Signals that occur close to a containing band, in the wrong direction
The first signal or station/base, especially if the slope remains unchanged and/or price is far from a higher TF band edge
Signals that occur in the wrong endzone, middle of the field
Signals that are approaching the base/ station, not leaving
Stations/bases that are being formed while on a higher TF there is plenty of room to move. Higher highs or lower lows are coming. If WPR1 is in the endzone, and WPR2 is close behind, wait for WPR2 to catch up.
That's a lot to be skeptical about. Are sure there's any baby left in that bathwater?
Description
Start on H4 and D1 and look at the D1/W1/MN trend - whatever shows up in the main chart window at widest zoom. Grok the trend.
The trend is your friend, boss. MOSTLY trade in the direction of Homeband H1 (orange-red) centerline for base (M15) trades, and MOSTLY trade in the direction of H4 (orange) centerline for station (H1) trades. When countertrend trading, trade light.
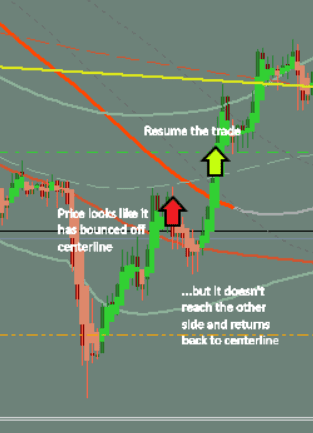
When should you countertrend trade at all? When price is near a set of higher TF bands and looks set to reverse. Then STRADDLE (or wait).
Use pending orders and straddles whenever possible.
Observe the centerlines of the band time period you’re trading within. If it bounces off the centerline that could be an early reversal. So, might be a place to straddle, especially on H1/H4. If it does bounce but then returns to the centerline before reaching one side that was probably a fake reversal, close the trade early and/or resume the original trade.
The more advice I give, the wishier-washier it sounds.
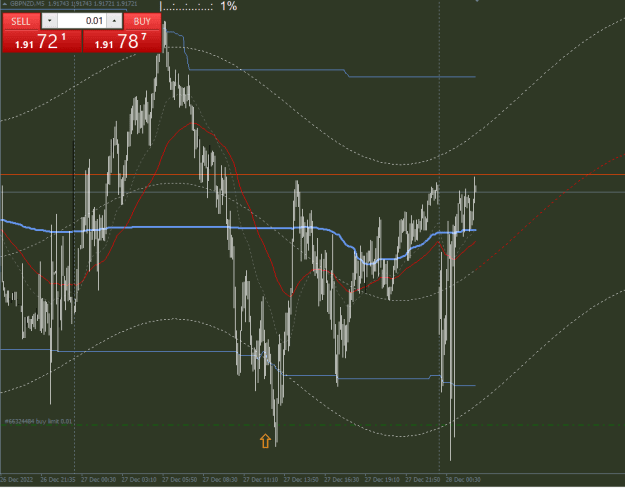
Attached Image (click to enlarge)
Look at all that spaghetti. Do you even know which lines I'm talking about? I don't and I made the damn thing.
Generally speaking price likes to dither and dally, and fakeout around the centerline. It may be better simply to ignore such wanderings, or place small contrary trades while the original trade is still in place.
(maybe) Wait for the HMA to change colour or ideally, pierce a band side. (It may be better to wait for the HMA on exits - you have tendency to exit too early. Let the HMA take you out?) HMA color change will often line up with new station/base exit or signal on Stoch.
Use stochastic for confirmation. Wait for signal in the correct endzone, and then wait for confirming Heiken candle.
Exit when band centerline turns against you (wait that long?) - wait for opposing candle, and usually HMA pierces the other side of the band, or when price leaves an opposing station/base or when stoch gives an opposing signal in the correct opposing endzone.
When scanning for opportunities look for prices where M15 band is near the top or bottom of the H1 (orange-red) bands. Look for price near the top (when shorting) or near the bottom (when going long) of the green (M15) bands. It is probably better to scan on H4 or D1 for likely targets, maybe even W1 although you’ll be waiting for a while for a valid signal and confirmation. Use one computer for trading, one for scanning.
After setting your first trade (anchor) wait for price to be clearly reversing on the higher TF band centerline before upping the anchor. This doesn’t stop you from placing an opposing anchor trade early.
Keep putting weight on the extremes of the ranges for the timeline you’re trading and keep removing it when the time is right.
Complicated. Wishy washy. A classic indicator of fuzzy confused thinking. I knew I had to simplify this and the 'simplification' became the next system. A common habit.