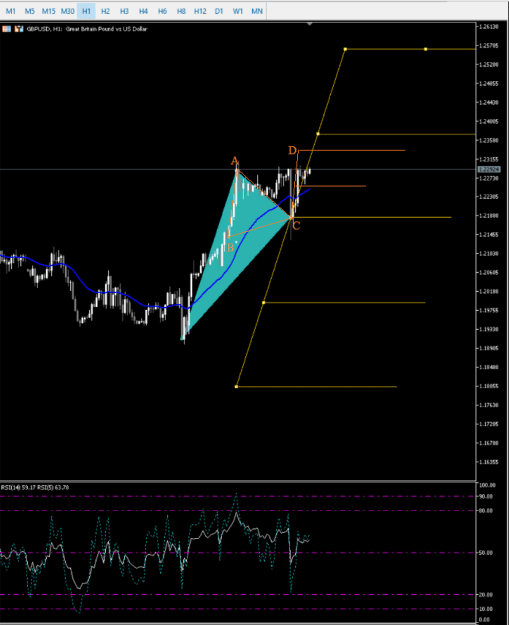
An ABC on H1 created? My plan next week. Until now H4 still above 26 EMA but lets monitoring. {image}
Ignored
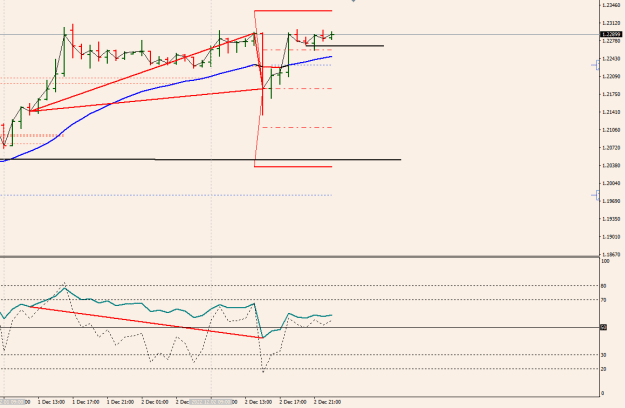
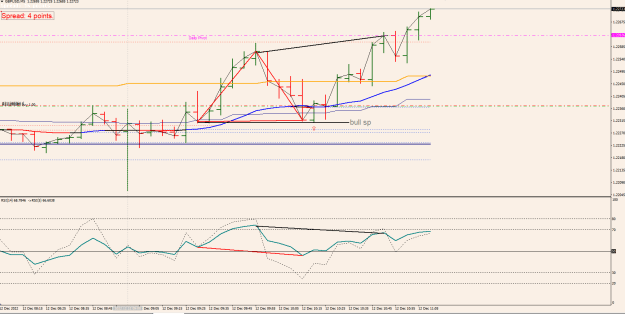
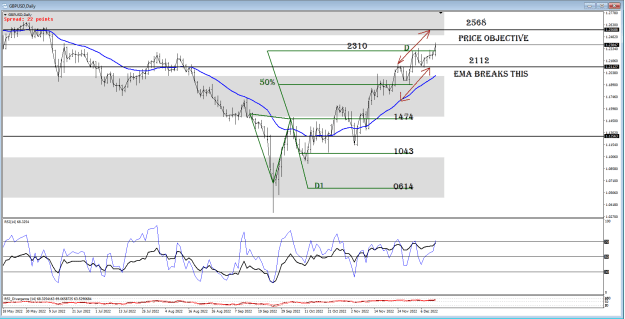
Plan for this week starting at Euro open with hopefully available screen time. All charts are on the up heading for the daily EMA as Alan has already mentioned around 1,25485. Currently price is ranging around a previous H4 EMA level at 1.22550 and the H1 looks to have found Bull support off this level. M15 much the same so I will be waiting on a M5 divergence to take me long entry from the M1 chart towards the daily target. M5 has an ABCD sell and making EMA higher highs.
lets have a good week.
An ABC on H1 created? My plan next week. Until now H4 still above 26 EMA but lets monitoring. {image}
Ignored
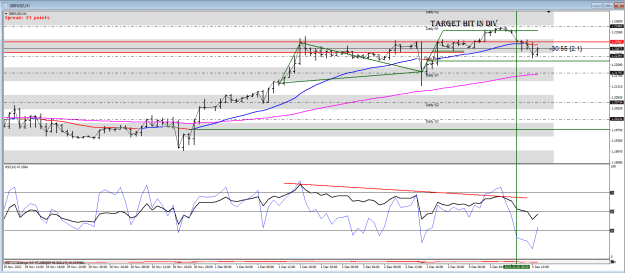
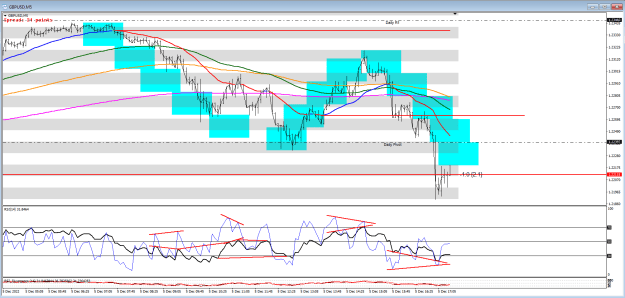
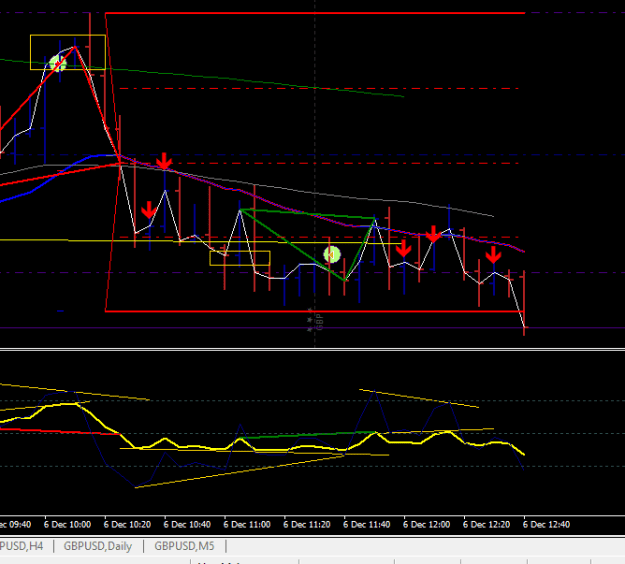
Your ABCD is drawn incorrectly. You have managed to B and C on the same side of the EMA they should be on opposite sides.
If you put a 1 period SMA on your chart and use bars instead of candles you will see these pivots more clearly.
Attached Image (click to enlarge)
Like this..
Attached Image (click to enlarge)
You should be able to see the target was hit and then a bear div formed to return price to the EMA. It has crossed and the bears are looking for support.
You should also see the div was at the daily R1
{quote} Your ABCD is drawn incorrectly. You have managed to B and C on the same side of the EMA they should be on opposite sides. If you put a 1 period SMA on your chart and use bars instead of candles you will see these pivots more clearly. {image} Like this.. {image} You should be able to see the target was hit and then a bear div formed to return price to the EMA. It has crossed and the bears are looking for support. You should also see the div was at the daily R1
Ignored
Woah, Thanks Alan so much for your correction. let me change it as your guide.
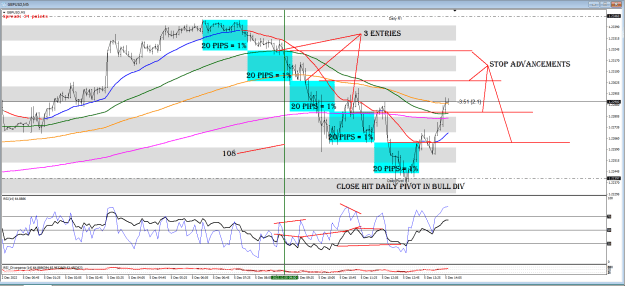
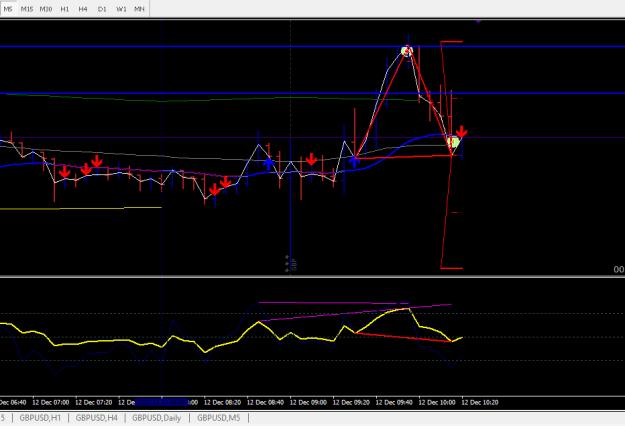
Another way to manage your trades is to use 1% boxes. Here I use 20 pips to represent 1% The first one begins at about the 108 where price comes off the high by 20 pips we place a short with a 20 pip stop. We get a second trade at the next 20 pips and advance our stop. We get a third trade at the next 20 pips and again advance our stop. Now all we can do is keep advancing the stops every 20 pips until we close. This trade made.. 4 x 1% 3 x 1% 2 x 1% Total 9% The max risk was only 1% {image} Note we could begin again at the bottom beginning our longs...
Ignored
What is your entry point here? is it when the price crosses the ema26 of the timeframes
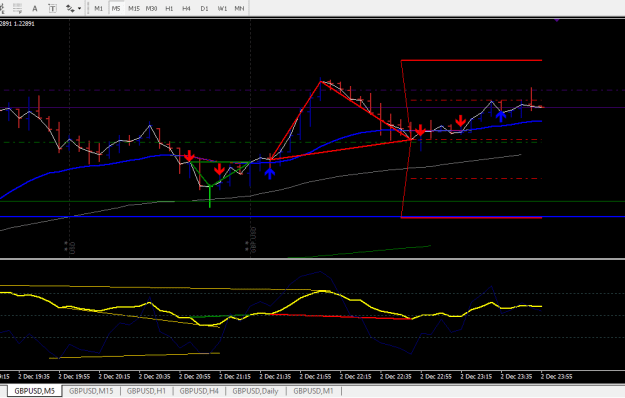
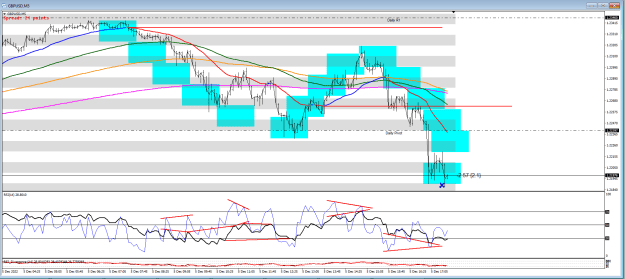
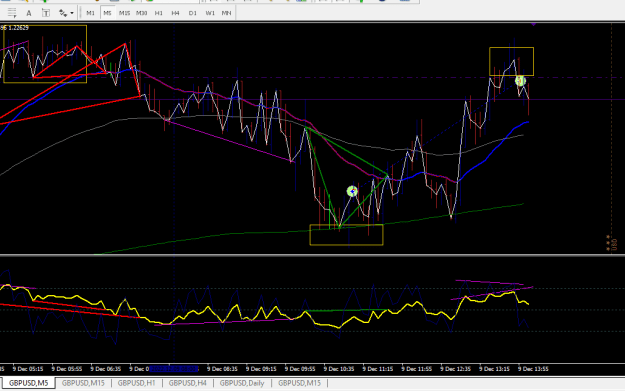
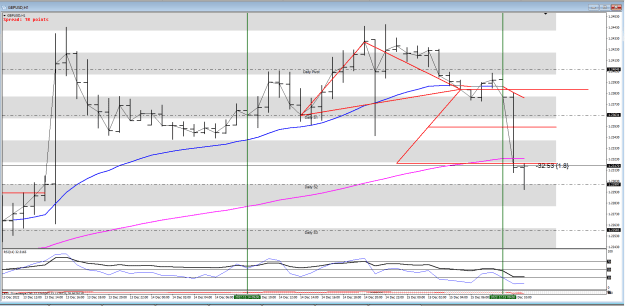
Managed to get lucky today. Missed all the divergences at euro open due to travelling. But got in at the H1 ZOO point and RSI divergence with my initial safe target being the M5 EMA. This was crossed forming an ABCD giving me a new target at 1.21695. Lots of spiky candles around the H4 EMA and another divergence near the bottom and struggling to reach target so closed it out. +34 pips. M5 EMA has reached the previous Low.
Managed to get lucky today. Missed all the divergences at euro open due to travelling. But got in at the H1 ZOO point and RSI divergence with my initial safe target being the M5 EMA. This was crossed forming an ABCD giving me a new target at 1.21695. Lots of spiky candles around the H4 EMA and another divergence near the bottom and struggling to reach target so closed it out. +34 pips. M5 EMA has reached the previous Low. {image}
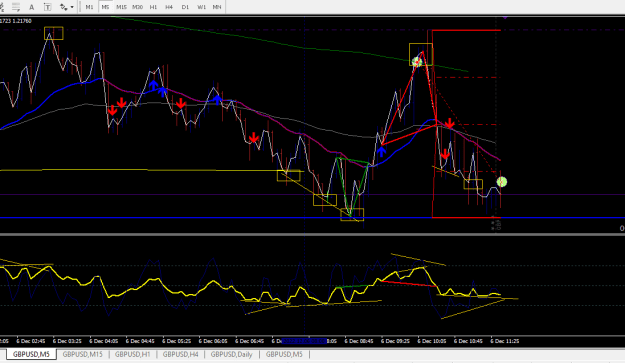
Ví dụ về kẻ thất bại. Nếu chúng tôi mua vào giao dịch cuối cùng này, chúng tôi sẽ bị dừng giao dịch vì thua lỗ 1% {image}
Ignored
Hi Alan, I have a question for this 1% method:
- Is the fence used when there is a bull div?
- Can 1% entries be preset or are they only done when the first 1% is available?
Thank you Alan
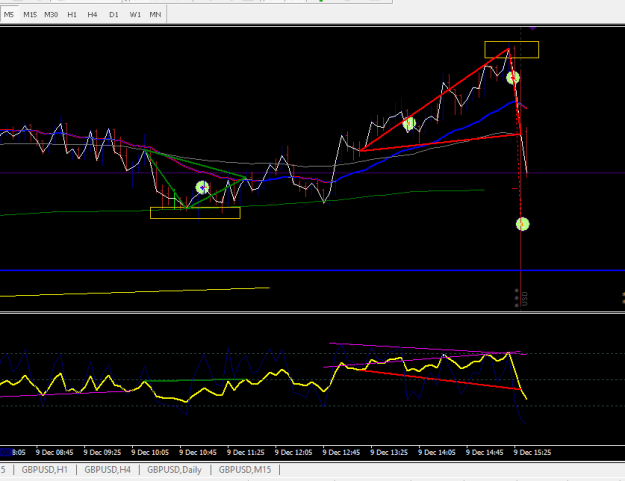
Another lucky short on the good dollar news spike for +53 pips. The M5 RSI divergence kept dragging on forever and I was watching the M1 for a sign of weakness.
Also RSI divergence on the M15 and regular divergence on the H1