• Home
  • Forums
  • Trades
  • News
  • Calendar
  • Market
  • Brokers
  • Login
  • Join
  • User/Email: Password:
  • 11:06am
Menu
  • Forums
  • Trades
  • News
  • Calendar
  • Market
  • Brokers
  • Login
  • Join
  • 11:06am
Sister Sites
  • Metals Mine
  • Energy EXCH
  • Crypto Craft

Options

Bookmark Thread

First Page First Unread Last Page Last Post

Print Thread

Similar Threads

Trade Direction Bias 0 replies

A journal to keep track of my bias on the market 6 replies

Trade The Charts - Reading Analysis Causes Bias 6 replies

Daily Bias 0 replies

Home Currency Bias? 12 replies

  • Trading Discussion
  • /
  • Reply to Thread
  • Subscribe
  • 10
Attachments: Survivorship Bias
Exit Attachments
Tags: Survivorship Bias
Cancel

Survivorship Bias

  • Last Post
  •  
  • 1 Page 2 3
  • 1 Page 2 3
  •  
  • Post #21
  • Quote
  • Nov 20, 2022 8:24am Nov 20, 2022 8:24am
  •  gepards
  • Joined May 2020 | Status: Newbie | 582 Posts
made some optimizations..

Year 2010 - 2017 - optimizations
Setups 3741. Optimized for "Max balance". Total sum of profits of all setups is 449738 $, 1861 setups profitable

Year 2017 - 2020 - forwardtests
From all those 3741 total sum -142243 $, 452 setups profitable

will try to simulate 10000 parallel EAs on completely random and scale winners. If 50% win vs 50% loses then that should work.

think the portfolio minimum is 10k EAs here.. 100 or 1000 are too small representative.. won't be 50/50 otherwise..

cant use MT5 pick ups.. MT5 pick up mostly winner in optimizations.. that won't guarantee 50/50 distribution in the future.

just thinking..
Fluctuations All Time Return: 479.2%
 
 
  • Post #22
  • Quote
  • Nov 21, 2022 10:43am Nov 21, 2022 10:43am
  •  Riskcuit
  • | Joined May 2021 | Status: Calculating Probabilities... | 18 Posts
Quoting yoriz
Disliked
After a long, heated debate with 2 fellow traders, I am curious to hear the opinion of others here on FF. People underestimate the power of today's computers. Data-mining software like Expert Advisor Studio, StrategyQuant, etc. try out thousands of random strategies per hour to hunt for good looking equity curves. Some people feel that a nice equity curve must mean the underlying strategy has some edge. They don't believe this can be just random chance. To prove a point, I created an expert advisor for MT5 that enters and exits the market at random...
Ignored

anything data mined will fail in the future unless it specifically targets a characteristic of prices distribution that is different what is normally expected.

Things that appear to be winners are really just long leads.

If you flip a coin 100 in times in a series, 100 times in a row, it won’t work out that each series has 1/2 of the results heads and 1/2 of the results tails, it works out that each series either has more heads than tails or more tails than heads.

Data mining finds the long leads and try’s to say the coin is not random because in each series 1/2 the results weren’t head and 1/2 results weren’t tails.
ri · skuht
 
 
  • Post #23
  • Quote
  • Nov 22, 2022 3:54pm Nov 22, 2022 3:54pm
  •  yoriz
  • Joined Dec 2016 | Status: Member | 152 Posts
Quoting AleksDark
Disliked
Okei, lets open up in simple example [...] Much lower, isn't it? But is it low enough for your entire capital? --> why not to use 20 strategies?
Ignored
Ok, what you describe is creating a portfolio of profitable strategies. When uncorrelated, they even out each others ups and downs giving you a more smooth equity curve. I fully agree with you.

However, would throwing together a bunch of edge-less strategies work? I think the strategies in the portfolio should each have an edge to be useful, right?

Quoting AleksDark
Disliked
Therefore 50% as all time and theoretical maximal losses in simulator is imo adequate. Imo, if you haven't got any long sequence of losses -- there might be not enough analysis done.
Ignored
Hahaha. I usually run a Monte Carlo simulation over all the trades in my backtest and tune the lotsize such that the drawdown in the 98th-percentile is less than 35%. This is just my arbitrary personal maximum risk tolerance before I start loosing sleep at night, so nothing magical about these numbers. See here for a post about this.

Quoting AleksDark
Disliked
And lets notice that 50% dd in strategy which has 2% of capital -- is a 1% total loss. Not bad, right?
Ignored
True! Never looked at it like that, but you are right that each strategy is part of a larger portfolio and thus the DD scales with the allocation of your capital.

Thank you for your valuable feedback!
 
 
  • Post #24
  • Quote
  • Nov 22, 2022 4:01pm Nov 22, 2022 4:01pm
  •  yoriz
  • Joined Dec 2016 | Status: Member | 152 Posts
Quoting MathTrader7
Disliked
Essentially there are some statistical tests that can be used to estimate the probability of having an edge or not (=random trading). If you are interested in this subject I recommend you to study the relevant subjects such as signal theory and stochastic control theory.
Ignored
Thank you. Good suggestion! I remember reading a long thread by AlgoTraderJo where he describes that the "measures" data-mining bias by running his data-mining (or ML training) on up to 200 synthetic timeseries that have the same characteristic as the original symbol, but then with returns shuffled in random order. He then compares his found strategy against the best strategies found using the synthetic data. If his strategy outperforms, say, 95% of the 200 other best strategies, he knows his strategy has an edge.

However, the above approach requires ridiculous amounts of CPU power. Something you can do when you are an institutional trader with lots of resources, but probably not as a retail trader.
 
1
  • Post #25
  • Quote
  • Nov 22, 2022 4:17pm Nov 22, 2022 4:17pm
  •  yoriz
  • Joined Dec 2016 | Status: Member | 152 Posts
Quoting joyny
Disliked
In Darwinex any trader is compared to 10000 random strategies.. Here for example 1 my strategy compared.
Ignored
Interesting way to visualize the performance! Thanks.

In the image it reads "compared to 10000 random strategies with the same risk". What does that mean? Do they make random equity curves based on your trades (i.e. Monte Carlo simulation)? Do they analyse your typical SL/TP levels and feed that to a random bot like mine?

My experiment shows that it is more likely than you expect to find profitable random strategies. I agree that having your strategy in the higher percentiles of the Darwinex plot is a good sign, but it is no guarantee unfortunately. It just shows that 90% of the random strategies performed worse, but also that even random strategies outperform your strategy in 10% of the cases!

Quoting joyny
Disliked
Meaningfull strategies outperform random in long run.
Ignored
Absolutely. But how long is long? ;-)
 
 
  • Post #26
  • Quote
  • Nov 22, 2022 4:18pm Nov 22, 2022 4:18pm
  •  yoriz
  • Joined Dec 2016 | Status: Member | 152 Posts
Quoting gepards
Disliked
if scale winners then this should compensate losers..
Ignored
What do you mean?
 
 
  • Post #27
  • Quote
  • Nov 22, 2022 4:26pm Nov 22, 2022 4:26pm
  •  yoriz
  • Joined Dec 2016 | Status: Member | 152 Posts
Quoting mtako
Disliked
You will see that with a worthwhile strategy, you will have results that are so different than your random testing above, and with enough data for it to be of value at all.
Ignored
Will a worthwhile strategy with an edge outperform all random strategies? I guess it will outperform, say, 90% of them but some random strategies will still be better. Or do you expect it to outperform significantly, say, 99.9% of the random strategies?

Quoting mtako
Disliked
If there is any logic + results = potential. If random and you are testing with enough data, you will simply not get tradeable results...
Ignored
Yes, indeed. However, keep in mind that nowadays we can easily generate millions of random strategies. So some of these millions will still show tradeable results!

With manually designed strategies after eye-balling charts for days, this is much less likely. Then comparing it against random strategies is probably much more useful.

Quoting mtako
Disliked
One could find more info to learn from the company Joyny posted above, Darwinex. As well as others, like QuandConnect, which has a community with a lot of info and sharing right here https://www.quantconnect.com/forum .
Ignored
Thank you for the pointers. Homework for me :-)

Quoting mtako
Disliked
Sure hope I've managed to help this time.
Ignored
Absolutely! Thank you for your info.
 
 
  • Post #28
  • Quote
  • Nov 22, 2022 4:28pm Nov 22, 2022 4:28pm
  •  yoriz
  • Joined Dec 2016 | Status: Member | 152 Posts
Quoting gepards
Disliked
If 50% win vs 50% loses then that should work.
Ignored
I am not sure what you are trying in your experiment? Keep in mind that the EA in post #1 really trades randomly. Backtests have no relevance for forward tests.
 
 
  • Post #29
  • Quote
  • Nov 23, 2022 1:43am Nov 23, 2022 1:43am
  •  gepards
  • Joined May 2020 | Status: Newbie | 582 Posts
Quoting yoriz
Disliked
{quote} What do you mean?
Ignored
Quoting yoriz
Disliked
Below is the distribution of the profits of all 1000 strategies found. As expected roughly half of the random strategies lose money, the other half makes a profit:
Ignored
50 vs 50.. if 50 wins and 50 losing accounts then those 50 winners when scaling maybe can compensate losers.

you had some from 100$ to 600$ results.. when scaling it turns out 100$ to 6400$ - that 1 winer alone compensates 64 wipeouts.
Fluctuations All Time Return: 479.2%
 
 
  • Post #30
  • Quote
  • Nov 23, 2022 2:02am Nov 23, 2022 2:02am
  •  gepards
  • Joined May 2020 | Status: Newbie | 582 Posts
Quoting yoriz
Disliked
{quote} I am not sure what you are trying in your experiment? Keep in mind that the EA in post #1 really trades randomly. Backtests have no relevance for forward tests.
Ignored
adjusted your EA.. made arrays of "EAs".. now can run 10000 instances. sl_money and tp_money can be 0 - then only random exits will work.
Attached File(s)
File Type: mq5 RandomFF_V03_arr.mq5   8 KB | 33 downloads
Fluctuations All Time Return: 479.2%
 
 
  • Post #31
  • Quote
  • Edited 2:26pm Nov 23, 2022 2:02pm | Edited 2:26pm
  •  yoriz
  • Joined Dec 2016 | Status: Member | 152 Posts
Quoting gepards
Disliked
adjusted your EA..
Ignored
Cool! Nice to see my code inspired you to improve on that and make something more advanced!

Quoting gepards
Disliked
made arrays of "EAs".. now can run 10000 instances. sl_money and tp_money can be 0 - then only random exits will work.
Ignored
Interesting experiment. I doubt that running a portfolio of 10,000 random EAs will be anything else than random, but doesn't hurt to try.

Adding a fixed SL and TP will still give random results, but you could wonder whether a trailing stop would bring a (tiny) edge since it does respond to price action. Perhaps something interesting for you to try out?

Keep us posted on your progress!
 
 
  • Post #32
  • Quote
  • Nov 23, 2022 3:49pm Nov 23, 2022 3:49pm
  •  joyny
  • Joined Nov 2019 | Status: Member | 630 Posts
Quoting yoriz
Disliked
But how long is long? ;-)
Ignored
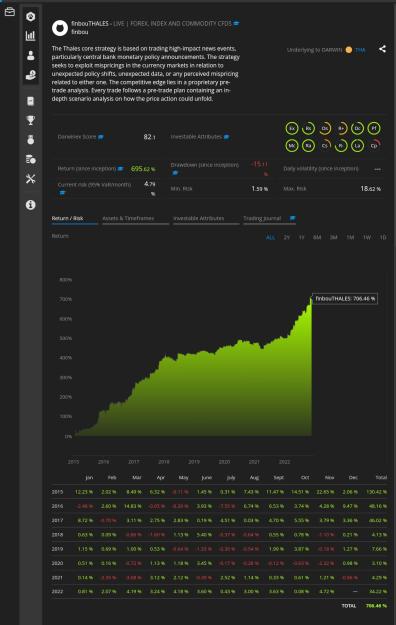
See darwin THA..8 years.. outperforms all 10000 random EAs.

Attached Image (click to enlarge)
Click to Enlarge

Name: IMG_20221123_224322.jpg
Size: 307 KB
 
 
  • Post #33
  • Quote
  • Nov 23, 2022 5:20pm Nov 23, 2022 5:20pm
  •  yoriz
  • Joined Dec 2016 | Status: Member | 152 Posts
Quoting joyny
Disliked
See darwin THA..8 years.. outperforms all 10000 random EAs.
Ignored
Nice curve. Yes, after 8 years this thing has certainly proven it has an edge and wasn't merely luck.
How about after 4 years? After 2 years? First year?

When are we confident this thing is actually making money and not just lucky?
 
 
  • Post #34
  • Quote
  • Nov 24, 2022 2:46am Nov 24, 2022 2:46am
  •  joyny
  • Joined Nov 2019 | Status: Member | 630 Posts
Quoting yoriz
Disliked
{quote} Nice curve. Yes, after 8 years this thing has certainly proven it has an edge and wasn't merely luck. How about after 4 years? After 2 years? First year? When are we confident this thing is actually making money and not just lucky?
Ignored
Never. Past performance guaranties/proove nothing.
 
 
  • Post #35
  • Quote
  • Nov 24, 2022 1:24pm Nov 24, 2022 1:24pm
  •  yoriz
  • Joined Dec 2016 | Status: Member | 152 Posts
Quoting joyny
Disliked
Never. Past performance guaranties/proove nothing.
Ignored
Hahaha. Fair enough
 
 
  • Post #36
  • Quote
  • Nov 25, 2022 1:16pm Nov 25, 2022 1:16pm
  •  danos
  • | Joined May 2012 | Status: Member | 24 Posts
Hi yoriz,

I just feel the urge to add my two cents on this. If there are more skilled statisticians around, please correct my statements.

Firstly, the classical argument -- you need more data to test the strategy on (be it wider timespan, other currencies or some bootstrapped timeseries). Generally, when we use statistical methods to test hypotheses, we work with a sample of data, and with this sample we aim to generalize our findings to the whole population (in our setup - some true data generating (TDGP) process). If we believe or measured, that more historical data will represent the (current) TDGP better, we should extend our sample, however, this decision should be done already in our research design - prior to any backtests. Therefore, any further post-backtesting analyses may just show, whether our estimates of the TDGP generalizes well to other time-series. This is certainly nice to see, but does not solve the issue you present. Put differently, if we assume the market is evolving and there is no single TDGP for the past 100 years, but rather a constantly changing one (which based on my experience is a reasonable assumption), more history will not help us to generalize to this TDGP as the far past is irrelevant. Also, if we can with some level of certainty estimate the TGDP on currency_1, testing it on currency_2 can lead to the false rejection of our findings on currency_1 as the currency_2 can behave very differently... So, the devil is not hidden here.

Secondly, someone proposed to decompose the signal from the noise in the market data, if I recall correctly. If you used the entries from the top strategy (you present in your post) as an explanatory variable of market returns, it would undoubtedly lead to a good extraction of signal from the high level of noise (higher signal-to-noise ratio as compared to the rest of the trials). So, this does not solve your problem either.

To finally answer the question, whether there is some better way to find strategies in the data-mining like fashion. I hope there is. For simplicity, let's say, we choose the strategies based on a single metric -- expected return. We can test a null hypothesis that the expected return is lower or equal to zero. We can test this hypothesis for each strategy generated by a different random seed -- 1000 times. If we reject the null on alpha=0.01 significance level, 10 of our rejections will be false positives (false discoveries), the rest of the rejected nulls, let's guess, 50 will be true positives. Right? NO! This would not definitely solve the problem your intuition tells you there is. The same question was already asked back in 1950s and since then, we moved further, to be able to address or cope with this issue. The core issue is that we test "same strategy" repeatedly on the same dataset. This is known as the multiple testing or multiple comparison problem. Therefore, if we look at the alpha, the false positive rate we allow for in our analyses, after several "similar" tests, the alpha need to be adjusted appropriately. We can do this by Šidák's correction, with which the alpha decreases as the number of trials increases. Allowing for alpha=0.01 in the research design, we shall aim to reject our nulls not on the 0.01 level, but after the correction with 1000 trials, at 1.005e-05 level. To be fair, this can also be problematic. Just to guide you further, this issue is well examined in the academic literature from different perspectives. One of which colud be the "most important plot in finance" (I haven't used it, just know there is something like that), it should address the same problem, look at it:

https://papers.ssrn.com/sol3/papers....act_id=3173146 -> slides, page 9 is sufficient.

or in

Bailey, D.H. and De Prado, M.L., 2014. The deflated Sharpe ratio: correcting for selection bias, backtest overfitting, and non-normality. The Journal of Portfolio Management, 40(5), pp.94-107.


Best regards.
 
1
  • Post #37
  • Quote
  • Nov 27, 2022 2:36pm Nov 27, 2022 2:36pm
  •  yoriz
  • Joined Dec 2016 | Status: Member | 152 Posts
Quoting danos
Disliked
Put differently, if we assume the market is evolving and there is no single TDGP for the past 100 years, but rather a constantly changing one (which based on my experience is a reasonable assumption), more history will not help us to generalize to this TDGP as the far past is irrelevant.
Ignored
Yes, indeed. Things have changed dramatically over the years. I once bought historical M1 data going back to 1987. Ranges, momentum, etc. are completely different from todays market.

In other thread on FF, @robots4me suggested to do a WFA based on the last 'x' trades (as opposed to the last 'x' months). I tend to agree with him. Intuitively that makes more sense.

Quoting danos
Disliked
We can test a null hypothesis that the expected return is lower or equal to zero. [...] This would not definitely solve the problem your intuition tells you there is. [...] the alpha need to be adjusted appropriately.
Ignored
Good point. We should compensate for the survivorship bias while backtesting (and rejecting) strategies. Thank you for pointing to Šidák's correction; I did not know that formula.

Quoting danos
Disliked
One of which colud be the "most important plot in finance" (I haven't used it, just know there is something like that), it should address the same problem, look at it: https://papers.ssrn.com/sol3/papers....act_id=3173146 -> slides, page 9 is sufficient. or in Bailey, D.H. and De Prado, M.L., 2014. The deflated Sharpe ratio: correcting for selection bias, backtest overfitting, and non-normality. The Journal of Portfolio Management, 40(5), pp.94-107.
Ignored
Interesting read! This brings new insights. Thank you for the excellent suggestion!

Funny quote from the presentation you linked: "Most claimed research findings in empirical Finance are likely false. Most quantitative firms invest in false positives". Oh no...
 
 
  • Post #38
  • Quote
  • Nov 28, 2022 4:53am Nov 28, 2022 4:53am
  •  MathTrader7
  • Joined Aug 2014 | Status: Trading | 2,155 Posts
[quote=danos;14234869 Firstly, the classical argument -- you need more data to test the strategy on (be it wider timespan, other currencies or some bootstrapped timeseries). Generally, when we use statistical methods to test hypotheses, we work with a sample of data, and with this sample we aim to generalize our findings to the whole population (in our setup - some true data generating (TDGP) process).[/quote]

Market price is a non-stationary time series, so having access to a deeper history of the price could not improve the statistical parameters estimations of the current time However, a strategy which is able to extract partly the true signal (i.e., an adaptive strategy) could exploit from more data, for example, as the evaluation/test set.
Trading is the hardest way to make easy money...
 
1
  • Post #39
  • Quote
  • Nov 30, 2022 1:41pm Nov 30, 2022 1:41pm
  •  yoriz
  • Joined Dec 2016 | Status: Member | 152 Posts
Quoting MathTrader7
Disliked
having access to a deeper history of the price could not improve the statistical parameters estimations of the current time
Ignored
For optimizing for today's market, you should indeed only use the last few months/years, not all historical data you can get your hands on.

Would having more history help when doing a Walk Forward Analysis? That way, you can do more "steps" and thus better determine whether the strategy, when optimized over a certain time period, was profitable in the next. If many of these steps were profitable, that could be a sign the strategy has an edge.

Or are we fooling ourselves and just raising the bar for random strategies to pass all tests, but still not really separating random strategies from those with an actual edge?
 
2
  • Post #40
  • Quote
  • Dec 4, 2022 7:08pm Dec 4, 2022 7:08pm
  •  Umberleigh
  • | Joined Sep 2021 | Status: Member | 48 Posts
Perhaps you could create a basket of pairs, the aggregate value of which would oscillate between drawdown and TP. The idea here is that "time" becomes your edge because you can choose to wait and close the basket when in profit.
 
1
  • Trading Discussion
  • /
  • Survivorship Bias
  • Reply to Thread
    • 1 Page 2 3
    • 1 Page 2 3
0 traders viewing now
  • More
Top of Page
  • Facebook
  • Twitter
About FF
  • Mission
  • Products
  • User Guide
  • Media Kit
  • Blog
  • Contact
FF Products
  • Forums
  • Trades
  • Calendar
  • News
  • Market
  • Brokers
  • Trade Explorer
FF Website
  • Homepage
  • Search
  • Members
  • Report a Bug
Follow FF
  • Facebook
  • Twitter

FF Sister Sites:

  • Metals Mine
  • Energy EXCH
  • Crypto Craft

Forex Factory® is a brand of Fair Economy, Inc.

Terms of Service / ©2023