• Home
  • Forums
  • Trades
  • News
  • Calendar
  • Market
  • Brokers
  • Login
  • Join
  • User/Email: Password:
  • 7:11am
Menu
  • Forums
  • Trades
  • News
  • Calendar
  • Market
  • Brokers
  • Login
  • Join
  • 7:11am
Sister Sites
  • Metals Mine
  • Energy EXCH
  • Crypto Craft

Options

Bookmark Thread

First Page First Unread Last Page Last Post

Print Thread

Similar Threads

Daily moving average on hourly/ minute chart 7 replies

Predicting target price?????? 4 replies

Only now I see a lot of Traders predicting the USD rallie for 2008! 2 replies

Predicting direction of economic releases 123 replies

Pure Price Action: Predicting the Current Move 9 replies

  • Commercial Content
  • /
  • Reply to Thread
  • Subscribe
  • 82
Attachments: Predicting the sp500 on the hourly chart
Exit Attachments
Tags: Predicting the sp500 on the hourly chart
Cancel

Predicting the sp500 on the hourly chart

  • Last Post
  •  
  • 1 2345 Page 6
  • 1 345 Page 6
  •  
  • Post #101
  • Quote
  • Nov 22, 2022 6:31am Nov 22, 2022 6:31am
  •  Hurst
  • | Commercial Member | Joined Aug 2014 | 2,008 Posts
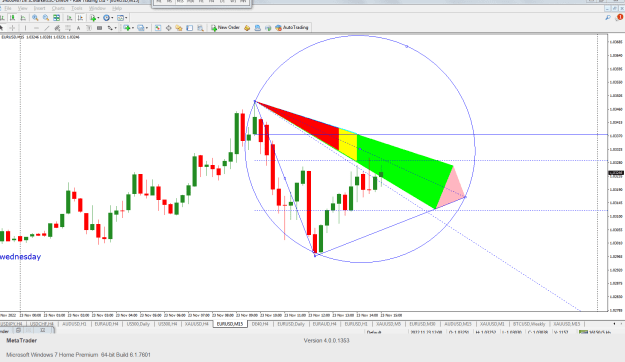
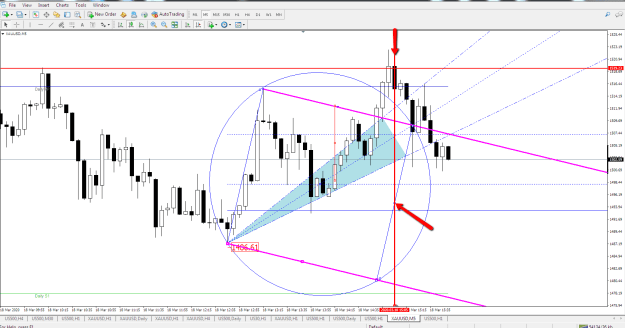
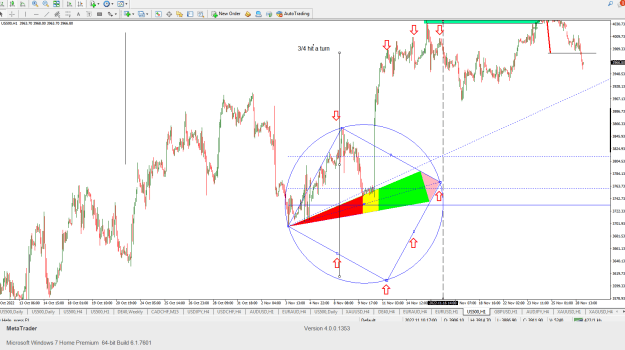
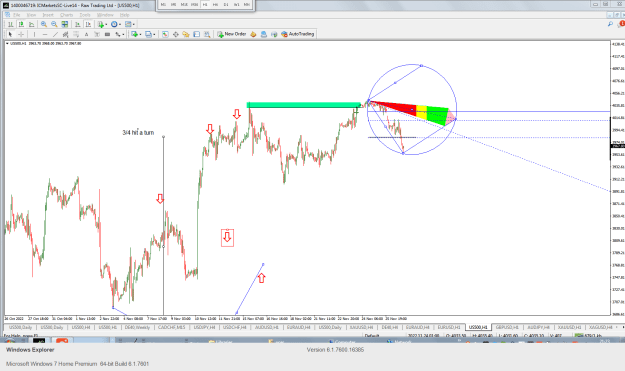
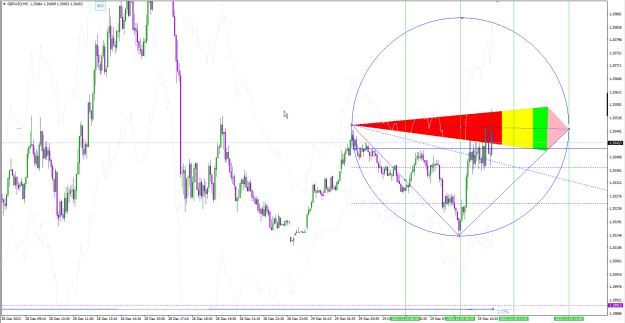
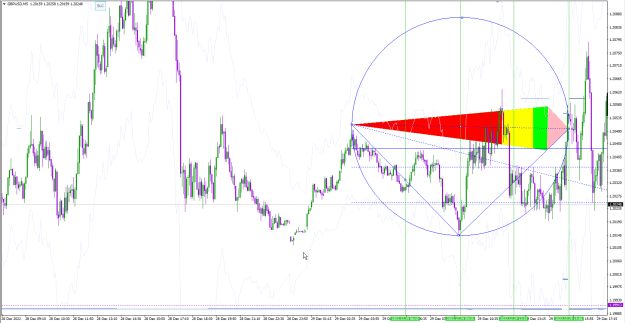
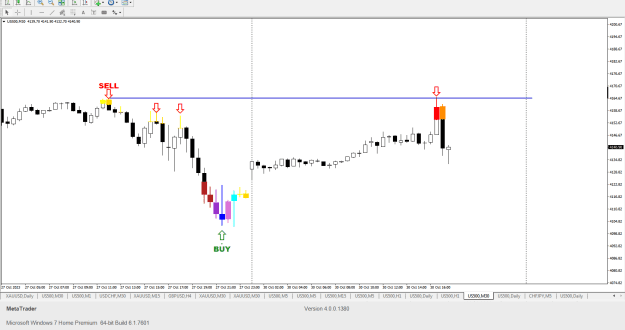
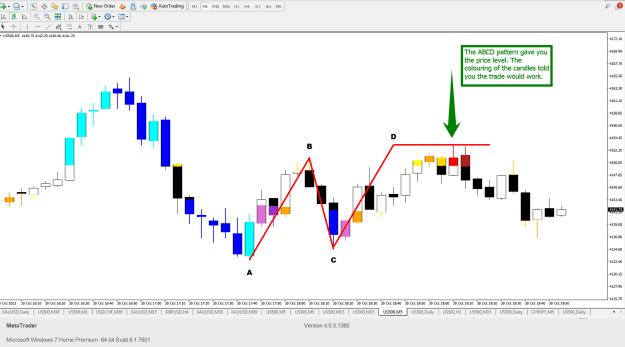
This was a great set up Ed, well done, I did not see the trade but it is the ideal shape, it looks right, you are in the trend the timing is perfect. I usually try to run the trade to the edge of the circle. But really good considering this is your first trade.
 
2
  • Post #102
  • Quote
  • Nov 22, 2022 7:56am Nov 22, 2022 7:56am
  •  SilentFather
  • Joined Jul 2018 | Status: Member | 738 Posts
Quoting watsone
Disliked
Early days folks but my first trade,a buy on The Dax,i believe the setup met all the criteria for a buy or i fluked it,went up over 100 points after entry,i only banked about a third of that though Be interesting to see Michael's thoughts on the setup {image}
Ignored
Amazing trade to be honest. For me it's very hard to get any trade in the yellow zone. Anyway.. we saw market broke last low. So I would say we should take it as sell. Even though trade would be great with low stoploss. It was ideal entry. That's what I would say..

SF
 
 
  • Post #103
  • Quote
  • Nov 23, 2022 8:20am Nov 23, 2022 8:20am
  •  Hurst
  • | Commercial Member | Joined Aug 2014 | 2,008 Posts
Do not worry about the yellow zone remember that as long as the price is at the yellow zone or past it you can take the trade.
Attached Image (click to enlarge)
Click to Enlarge

Name: Past the yellow Zone.png
Size: 36 KB
 
 
  • Post #104
  • Quote
  • Nov 23, 2022 12:52pm Nov 23, 2022 12:52pm
  •  SilentFather
  • Joined Jul 2018 | Status: Member | 738 Posts
Quoting Hurst
Disliked
Do not worry about the yellow zone remember that as long as the price is at the yellow zone or past it you can take the trade.{image}
Ignored
Hurst you told me that I should never sell in uptrend. This is considered uptrend I believe. Am I wrong? Or why you would try to sell here?

Thank you :o)
 
 
  • Post #105
  • Quote
  • Nov 23, 2022 1:16pm Nov 23, 2022 1:16pm
  •  watsone
  • | Joined Nov 2004 | Status: Member | 62 Posts
I would've thought the trend is down now,the lows of candlesticks to the right of the chart are lower than the lows of the candlesticks to the left
 
 
  • Post #106
  • Quote
  • Nov 23, 2022 7:29pm Nov 23, 2022 7:29pm
  •  Hurst
  • | Commercial Member | Joined Aug 2014 | 2,008 Posts
I thought the trend was down, notice I was not selling the top but a retrace, it failed sadly.
 
 
  • Post #107
  • Quote
  • Nov 24, 2022 2:20am Nov 24, 2022 2:20am
  •  SilentFather
  • Joined Jul 2018 | Status: Member | 738 Posts
I got you guys. But on H1 definitely not downtrend. I'll check into this later. We need to filter it more probably.

SF
 
 
  • Post #108
  • Quote
  • Nov 25, 2022 6:09am Nov 25, 2022 6:09am
  •  Hurst
  • | Commercial Member | Joined Aug 2014 | 2,008 Posts
I added a 12 period simple MA, rules if you are under look for sells above look for buys.

Only use hour chart or H4 for trade selection, fine tune on 5 min.
 
1
  • Post #109
  • Quote
  • Edited 1:50pm Nov 25, 2022 1:23pm | Edited 1:50pm
  •  Hurst
  • | Commercial Member | Joined Aug 2014 | 2,008 Posts
When I was developing the indicator I noticed so very interesting relationships in not only time but also price.

I have listed these below:
Attached Image (click to enlarge)
Click to Enlarge

Name: 2020-03-22_1950.png
Size: 38 KB

see how the top square edge on the RHS marks the top of the retrace in time

Attached Image (click to enlarge)
Click to Enlarge

Name: 2020-03-22_2012.png
Size: 40 KB

The time to the middle of the circle within one bar equalled the retracement to the upper edge of the triangle.
Attached Image (click to enlarge)
Click to Enlarge

Name: QT_MAgic_circle.png
Size: 30 KB


Mid Point of the square marks the top in time
Attached Image (click to enlarge)
Click to Enlarge

Name: QT_MAgic_circle_4.png
Size: 35 KB
Lastly a square out
Attached Image (click to enlarge)
Click to Enlarge

Name: QT_MAgic_circle_6.png
Size: 42 KB

When I went back to see how this trade worked I saw the timing was spot on
Attached Image (click to enlarge)
Click to Enlarge

Name: QT_MAgic_circle_7.png
Size: 38 KB


So there are time elements in the calculation of the square which are well worth watching. These are the end points and the midpoints of the square.

Same dynamic on this chart except its to the lower edge of the triangle and right on the mid point of the square.
Attached Image(s) (click to enlarge)
Click to Enlarge

Name: 2020-03-22_2001.png
Size: 30 KB
Click to Enlarge

Name: result of trade.png
Size: 31 KB
 
2
  • Post #110
  • Quote
  • Nov 28, 2022 4:20pm Nov 28, 2022 4:20pm
  •  Hurst
  • | Commercial Member | Joined Aug 2014 | 2,008 Posts
Hypermagic Line Indicator Reaction Points in Time
Attached Image (click to enlarge)
Click to Enlarge

Name: Reaction Points.png
Size: 36 KB

The mid points and end points of the square, and the edge of the circle often give turns in time.
 
 
  • Post #111
  • Quote
  • Nov 28, 2022 4:29pm Nov 28, 2022 4:29pm
  •  Hurst
  • | Commercial Member | Joined Aug 2014 | 2,008 Posts
The SP500 is shaping up for a sell trade soon
Attached Image (click to enlarge)
Click to Enlarge

Name: sp500 looking like a sell is due only in the yellow zone or after.png
Size: 45 KB
I seem to be the only one on FF that makes market calls before they happen. I think I posted it here or on my Telegram channel
Attached Image (click to enlarge)
Click to Enlarge

Name: Predicting the SP500.png
Size: 147 KB
So if you are not on my Telegram channel you should be.
 
 
  • Post #112
  • Quote
  • Nov 29, 2022 12:54am Nov 29, 2022 12:54am
  •  SilentFather
  • Joined Jul 2018 | Status: Member | 738 Posts
Quoting Hurst
Disliked
The SP500 is shaping up for a sell trade soon {image}I seem to be the only one on FF that makes market calls before they happen. I think I posted it here or on my Telegram channel{image}So if you are not on my Telegram channel you should be.
Ignored
It made new low. We would redraw to correct it?

SF
 
 
  • Post #113
  • Quote
  • Nov 29, 2022 8:27am Nov 29, 2022 8:27am
  •  Hurst
  • | Commercial Member | Joined Aug 2014 | 2,008 Posts
Yes exactly, new lows and the indicator needs to be refreshed.
 
 
  • Post #114
  • Quote
  • Dec 2, 2022 10:11am Dec 2, 2022 10:11am
  •  Hurst
  • | Commercial Member | Joined Aug 2014 | 2,008 Posts
I sent this gold chart to one of our indicator owners last night.

Attached Image (click to enlarge)
Click to Enlarge

Name: gold.png
Size: 27 KB
Ideal price action to look for a retrace in gold to sell.
 
1
  • Post #115
  • Quote
  • Last Post: Dec 30, 2022 8:41am Dec 30, 2022 8:41am
  •  SilentFather
  • Joined Jul 2018 | Status: Member | 738 Posts
Still performs well... Even on the 5 minute chart!

Before
Attached Image (click to enlarge)
Click to Enlarge

Name: screenshot.png
Size: 36 KB
After (We would sell the pullback up to the line in yellow zone)
Attached Image (click to enlarge)
Click to Enlarge

Name: screenshot.png
Size: 40 KB
SF
 
1
  • Commercial Content
  • /
  • Predicting the sp500 on the hourly chart
  • Reply to Thread
    • 1 2345 Page 6
    • 1 345 Page 6
0 traders viewing now
Top of Page
  • Facebook
  • Twitter
About FF
  • Mission
  • Products
  • User Guide
  • Media Kit
  • Blog
  • Contact
FF Products
  • Forums
  • Trades
  • Calendar
  • News
  • Market
  • Brokers
  • Trade Explorer
FF Website
  • Homepage
  • Search
  • Members
  • Report a Bug
Follow FF
  • Facebook
  • Twitter

FF Sister Sites:

  • Metals Mine
  • Energy EXCH
  • Crypto Craft

Forex Factory® is a brand of Fair Economy, Inc.

Terms of Service / ©2023