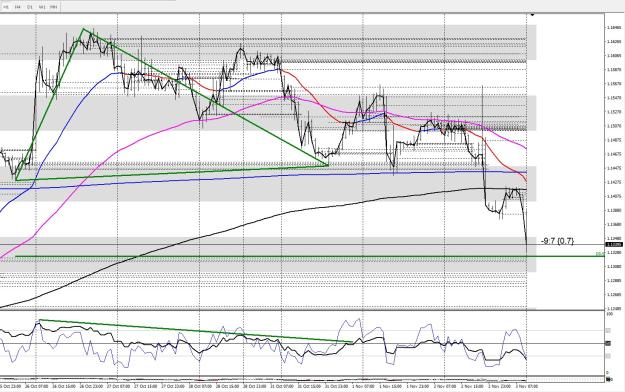
{quote} Master, can you share your chart? Sure you had followed this bear div on H1. {image}
Ignored
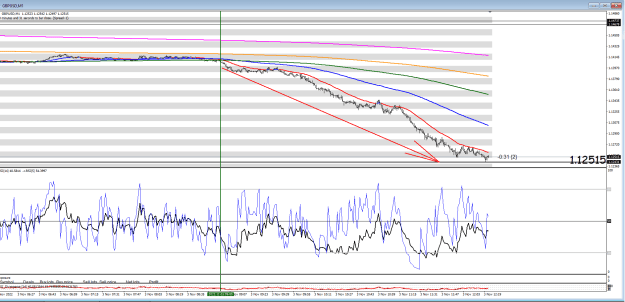
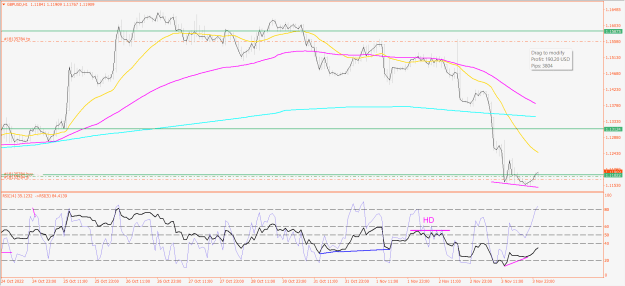
All you need to do is look at the 1 min chart to see price is consistently trading below the average. As I said ages ago, we need to see price get back above this to be considering longs.
{quote} All you need to do is look at the 1 min chart to see price is consistently trading below the average. As I said ages ago, we need to see price get back above this to be considering longs. Don't try to make it more complicated than it is. {image}
Ignored
Thank you, master. I'll keep that in mind for the future.
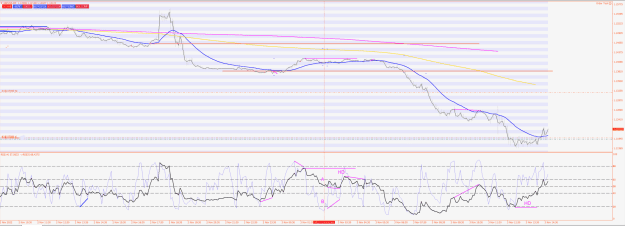
{quote} This is not right. If you see a div on a chart, then the target is also on the same chart. A bull div on the 5 min should reach the EMA on the 5 min also. Also, a period of consolidation will cause the EMA to come to the price as it plays catch up. The market tends to remain relatively flat for longer periods than trends.
Ignored
Thank you so much and well noted Alan.
I was too excited on the pullback of H1.
It seems on H1 it comes to a consolidation period.
It plays pingpong on both sides of M5 EMA now.
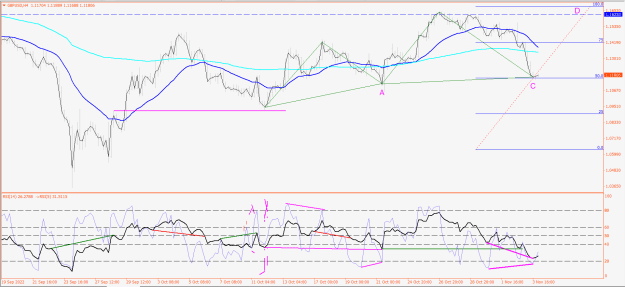
But in H4 I see an RSI bull div and an ABCD pattern.
Thus I am expecting after the consolidation on H1 it will head up northward to D.
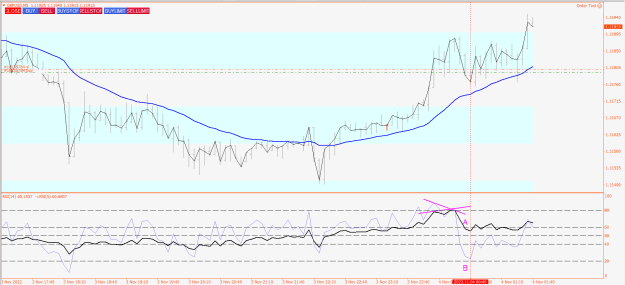
There is a Reg Bull Div on H1 thus I looked for a long opportunity on M5
Attached Image (click to enlarge)
On M5 I saw a weakness sign of the bear. They tried to push price back down but couldn't across EMA.
The fast RSI went down to oversold area but the slow still keep above waterline.
It seems the bear is loosing steam.
Attached Image (click to enlarge)
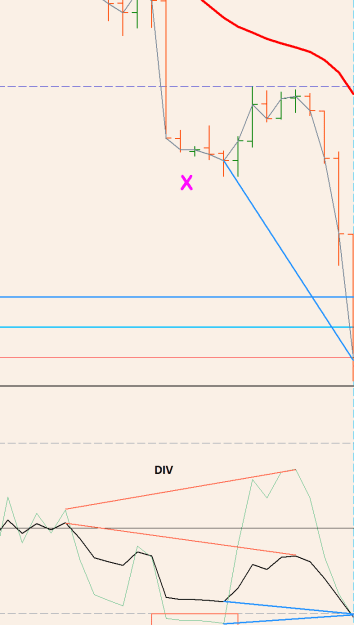
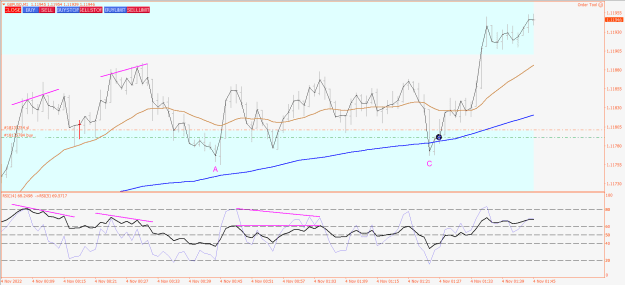
I went down to M1 looking for entry.
I saw at point C price was trying to attack point A but failed.
RSI made their LL but price couldn't.
Thus I went long on the next bar