• Home
  • Forums
  • Trades
  • News
  • Calendar
  • Market
  • Brokers
  • Login
  • Join
  • 9:09am
Menu
  • Forums
  • Trades
  • News
  • Calendar
  • Market
  • Brokers
  • Login
  • Join
  • 9:09am
Sister Sites
  • Metals Mine
  • Energy EXCH
  • Crypto Craft

Options

Bookmark Thread

First Page First Unread Last Page Last Post

Print Thread

Similar Threads

GBPUSD- daily, intraday signals 8 replies

Intraday Pound Trades on 5min chart [GBPUSD] 36 replies

Moving from intraday trading to weekly trading 9 replies

Intraday S/R Level Trading on EURUSD and GBPUSD 8 replies

Best Intraday Trading System 5 replies

  • Interactive Trading
  • /
  • Reply to Thread
  • Subscribe
  • 34
Attachments: GBPUSD intraday trading
Exit Attachments
Tags: GBPUSD intraday trading
Cancel

GBPUSD intraday trading

  • Last Post
  •  
  • 1 23 Page 4
  • 1 23 Page 4
  •  
  • Post #61
  • Quote
  • Jun 18, 2022 3:35am Jun 18, 2022 3:35am
  •  Fibonacci.bd
  • | Joined Oct 2021 | Status: Member | 138 Posts
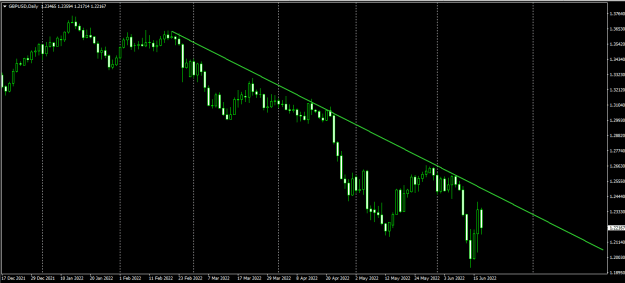
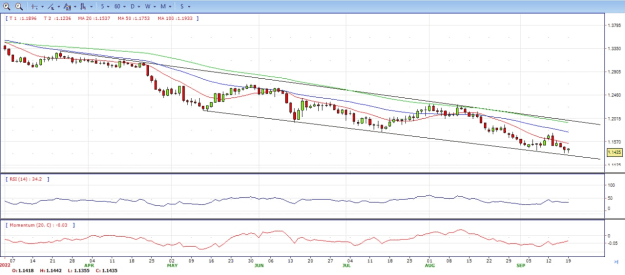
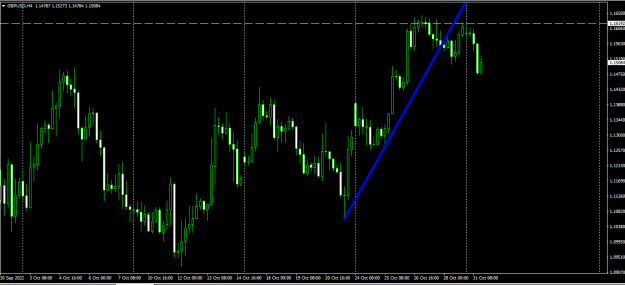
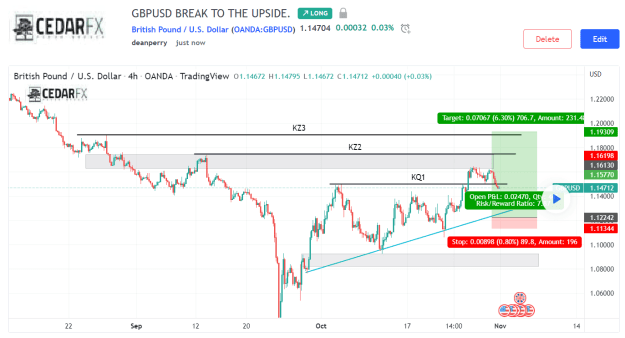
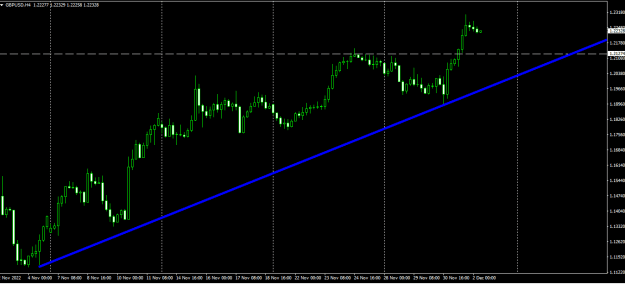
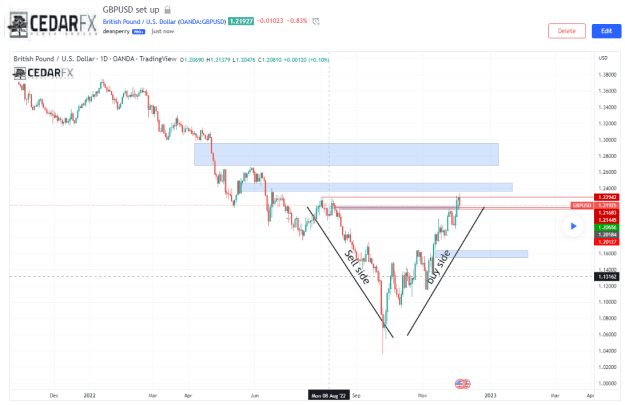
The pair has been in a bullish correction in the daily chart. The down trending trend line is still in play. The sellers may keep their eyes on the pair to go short from the resistance of that trend line.
Attached Image (click to enlarge)
Click to Enlarge

Name: gbpusd.png
Size: 15 KB
 
 
  • Post #62
  • Quote
  • Jun 22, 2022 1:04am Jun 22, 2022 1:04am
  •  bobhowson
  • Joined Apr 2013 | Status: Member | 202 Posts
Hi Everyone, I'm having a nice run on the GBPUSD pair at the moment. The trade below is a SELL on the H4 timeframe.
Lately I've been using the NB-Channel with 20MA & 5MA.
Attached Image (click to enlarge)
Click to Enlarge

Name: GBPUSDH4.png
Size: 16 KB
 
 
  • Post #63
  • Quote
  • Jun 22, 2022 4:26am Jun 22, 2022 4:26am
  •  Fibonacci.bd
  • | Joined Oct 2021 | Status: Member | 138 Posts
The pair has been bearish today. It made a good bearish move to start its day. A bearish breakout below 1.21600 may drive the price towards the South further. Meanwhile, it may get choppy in the intraday charts.
 
 
  • Post #64
  • Quote
  • Jun 27, 2022 1:31pm Jun 27, 2022 1:31pm
  •  dean198
  • | Joined Nov 2019 | Status: Member | 54 Posts
GBPUSD now in consolidation phase. on the 4 hour and daily.
the lower red line is a previous area of liquidity on the weekly and shows a FVG. Along with that this pair has been in the sell side of the model for a very long time.

On the 4 hour we have had two goes at dropping lower and failed to hold or break in any direction. with the 2 areas I have marked out I would like to see another fake run to the down side to suck the sellers in again and then look to break the last 4hour high and in to the green zone. if we get that we could then be on for a 4 hour and daily break of structure.
Not looking to be a buyer at the very low but will looking for conformation in a short term bias and holding off in till we break the consolidation phase.
Attached Image (click to enlarge)
Click to Enlarge

Name: GBPUSD consolidation.png
Size: 60 KB
 
 
  • Post #65
  • Quote
  • Jun 28, 2022 1:13am Jun 28, 2022 1:13am
  •  Fibonacci.bd
  • | Joined Oct 2021 | Status: Member | 138 Posts
The pair is having consolidation in the H4 chart. Traders are to be very patient here. The H4 chart shows that there is a down trending trend line, which has been working as a level of resistance. The buyers may wait for the price to make a bullish breakout at the trend line to go long in the pair. On the other hand, the sellers may wait for the price to produce a bearish reversal pattern to go short in the pair.
 
 
  • Post #66
  • Quote
  • Jul 5, 2022 3:35pm Jul 5, 2022 3:35pm
  •  Treeny
  • | Joined Feb 2019 | Status: Member | 126 Posts
Don't often see it as low as this so I'm expecting a turnaround soon. Hold on.........Boris's cabinet is resigning on him, this could fall more now
 
 
  • Post #67
  • Quote
  • Jul 5, 2022 4:56pm Jul 5, 2022 4:56pm
  •  momo3HC
  • | Joined Feb 2019 | Status: Member | 200 Posts
Not looking very bullish on a daily chart but could be a good time for some longs.
 
 
  • Post #68
  • Quote
  • Aug 2, 2022 4:59am Aug 2, 2022 4:59am
  •  Fibonacci.bd
  • | Joined Oct 2021 | Status: Member | 138 Posts
GBPUSD has been very bearish today in the intraday charts. The price has been obeying a down trending trend line. The sellers may wait for the price to consolidate and bearish breakout to go short. On the other hand, the buyers must wait for the price to make an explicit breakout at the trend line to go long in the pair as far as intraday charts are concerned.
Attached Image (click to enlarge)
Click to Enlarge

Name: gbpusd.png
Size: 12 KB
 
 
  • Post #69
  • Quote
  • Sep 20, 2022 7:06am Sep 20, 2022 7:06am
  •  GabFort
  • | Joined May 2022 | Status: Member | 15 Posts

•GBP/USD is back to trading flat on the day as the bulls move in from the lows of 1.1355, taking on the 1.14 area again. The pair ended Monday around 1.1435, modestly up for the day and still bearish in the daily chart.

•The sentiment surrounding surging inflation and tighter monetary policy continues to run the show, favoring the US dollar more so as the UK economy fares poorly vs. the US economy. The greenback remains close to two-decade highs as per the US dollar index DXY which measures the currency against six counterparts. DXY was up at 110.18 the high on Monday, not far from 20-year high of 110.79 hit on September. 7.

•Risk-off sentiment is also contributing to a higher US dollar in the face of the aggressive tightening path that global banks are on as they try to contain uncomfortably high inflation. A slew of central banks will meet this week and Fed funds futures have priced in a 79% chance of a 75-basis-point rate hike this week and a 21% probability of a 100-basis-point increase at the conclusion of the Fed committee's two-day policy meeting. Meanwhile, the BoE is expected to raise rates by either 50bps and 75bps.

•The GBP/USD offers bearish stance in daily chart, it maintains the downward slope and now is stabilized below all main SMAs, indicating bearish strength. Meanwhile, the 20 SMA continued accelerating south and developing far below longer ones, suggesting bears not exhausted yet. On upside, The immediate resistance is 1.1540 with a break above it exposing to 1.1740.

•Techinical readings in the daily chart support the bearish stances. RSI indicator stabilized around 34, while the Momentum indicator stabilized below the midline, suggesting downward potentials. On downside, the immediate support is 1.1350, unable to defend this level will resume the decline to 1.1300.

Attached Image (click to enlarge)
Click to Enlarge

Name: D0E96D5F-1C4C-4055-96A4-3DB44D896093.png
Size: 127 KB
 
 
  • Post #70
  • Quote
  • Sep 22, 2022 3:27am Sep 22, 2022 3:27am
  •  Fibonacci.bd
  • | Joined Oct 2021 | Status: Member | 138 Posts
The pair has been down trending in the H4 chart by obeying a trend line. Traders are to be watchful what the price does around the trend line. Keep an eye on today's massive news events that most probably create extreme volatility (intraday charts).
 
 
  • Post #71
  • Quote
  • Oct 31, 2022 12:03pm Oct 31, 2022 12:03pm
  •  Fibonacci.bd
  • | Joined Oct 2021 | Status: Member | 138 Posts
The H4 chart shows that the price made a breakout at an up trending trend line by producing a Double Top. It produced two consecutive bearish candles as well. As of writing, the price has been making a bullish correction. A bearish reversal candle may drive the price towards the South with good momentum.
Attached Image (click to enlarge)
Click to Enlarge

Name: gbpusd.png
Size: 14 KB
 
 
  • Post #72
  • Quote
  • Oct 31, 2022 5:30pm Oct 31, 2022 5:30pm
  •  dean198
  • | Joined Nov 2019 | Status: Member | 54 Posts
Back on the GBPUSD set ups now and we look to be slowly making our way back up.
I will be watching these 3 key zones to see how we react and move past them. As you can see I have marked out a buy idea where I would like to see GBP fall and break the trendline taking some of the buyers out the market and then push back up to the upside and make a new high, i feel we have interest rate news coming out soon and new budget info that could drive this pair nicely higher.
what's your thoughts on GU at the moment?
Attached Image (click to enlarge)
Click to Enlarge

Name: Gbpusb set up.png
Size: 51 KB
 
 
  • Post #73
  • Quote
  • Oct 31, 2022 5:41pm Oct 31, 2022 5:41pm
  •  Treeny
  • | Joined Feb 2019 | Status: Member | 126 Posts
Have to agree. Can only go up from here after the disastrous economic decisions in the UK lately.
 
 
  • Post #74
  • Quote
  • Nov 2, 2022 2:05pm Nov 2, 2022 2:05pm
  •  Fibonacci.bd
  • | Joined Oct 2021 | Status: Member | 138 Posts
It seems to have found its support at 1.14600 in the H4 chart. The price may head towards the last swing high. A bullish breakout at the last swing high may generate more bullish pressure in the pair.
 
 
  • Post #75
  • Quote
  • Nov 3, 2022 5:14am Nov 3, 2022 5:14am
  •  Erebus
  • Joined Jul 2011 | Status: Member | 7,411 Posts
Quoting Fibonacci.bd
Disliked
It seems to have found its support at 1.14600 in the H4 chart. The price may head towards the last swing high. A bullish breakout at the last swing high may generate more bullish pressure in the pair.
Ignored
Support, interesting concept, 1.14600 you said, 4H chart

Attached Image (click to enlarge)
Click to Enlarge

Name: 2022-11-03_19-04-32.jpg
Size: 439 KB
If you chase two rabbits, you will catch neither one!
Brain Surgery Return This Year: 21.4%
 
 
  • Post #76
  • Quote
  • Nov 11, 2022 7:01am Nov 11, 2022 7:01am
  •  Fibonacci.bd
  • | Joined Oct 2021 | Status: Member | 138 Posts
The pair has been heading towards the North by obeying an up trending channel. I assume it may make a good bullish move in the H4 chart. The price may find its resistance around 1.22500 next.
 
 
  • Post #77
  • Quote
  • Dec 2, 2022 1:19am Dec 2, 2022 1:19am
  •  Fibonacci.bd
  • | Joined Oct 2021 | Status: Member | 138 Posts
The pair has been bullish in the H4 chart. An up trending trend line is in play. If the price makes a bearish correction, the buyers may wait for the price to produce a bullish reversal pattern at the flipped support to go long in the pair.
Attached Image (click to enlarge)
Click to Enlarge

Name: gbp.png
Size: 14 KB
 
 
  • Post #78
  • Quote
  • Dec 5, 2022 1:33pm Dec 5, 2022 1:33pm
  •  dean198
  • | Joined Nov 2019 | Status: Member | 54 Posts
GBPUSD
This pair has been been running a classic sell to buy model from the bounce at the bottom, we have just taken out a high so we could see a short term retracement, i have marked out where i will be looking for GU to fall to and then look for further long positions to the higher levels marked out and continue to take out the highs, this would be in keeping with the Dxy falling also.
I any one got any set ups they can see forming on this pair or do you think we will make it to the higher levels?
Attached Image (click to enlarge)
Click to Enlarge

Name: GBPUSD set up.png
Size: 42 KB
 
 
  • Post #79
  • Quote
  • Dec 8, 2022 12:38am Dec 8, 2022 12:38am
  •  Fibonacci.bd
  • | Joined Oct 2021 | Status: Member | 138 Posts
The pair made a good bearish move in the H4 chart. However, an up trending trend line's support still holds the price. It is now traded around that trend line. A bullish reversal pattern may push the price towards the North again.
 
 
  • Post #80
  • Quote
  • Last Post: Dec 16, 2022 2:14am Dec 16, 2022 2:14am
  •  Fibonacci.bd
  • | Joined Oct 2021 | Status: Member | 138 Posts
The pair made a strong bearish move in the H4 chart. It has been in bullish correction. A bearish reversal at the flipped resistance may drive the price towards the South.
Attached Image (click to enlarge)
Click to Enlarge

Name: gbp.png
Size: 13 KB
 
 
  • Interactive Trading
  • /
  • GBPUSD intraday trading
  • Reply to Thread
    • 1 23 Page 4
    • 1 23 Page 4
0 traders viewing now
Top of Page
  • Facebook
  • X
About FF
  • Mission
  • Products
  • User Guide
  • Media Kit
  • Blog
  • Contact
FF Products
  • Forums
  • Trades
  • Calendar
  • News
  • Market
  • Brokers
  • Trade Explorer
FF Website
  • Homepage
  • Search
  • Members
  • Report a Bug
Follow FF
  • Facebook
  • X

FF Sister Sites:

  • Metals Mine
  • Energy EXCH
  • Crypto Craft

Forex Factory® is a brand of Fair Economy, Inc.

Terms of Service / ©2023