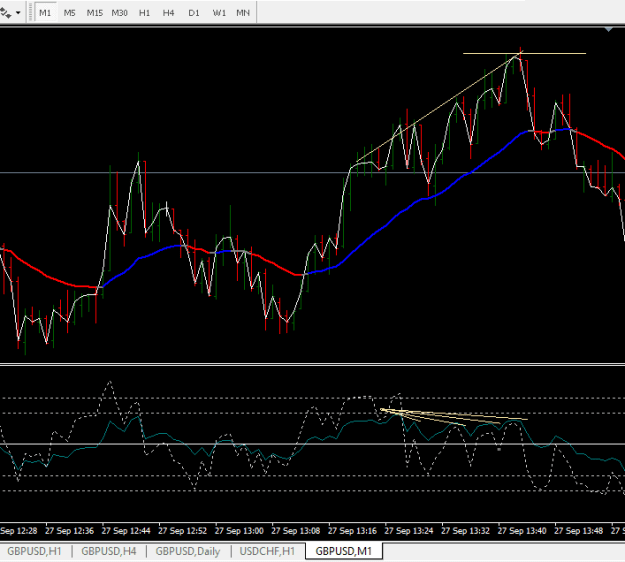
{quote} Dear Master, do you trade by only this M1 chart? How do you reference M5, H1 for these trades Where your order, entry and take profit that you traded by this M1 chart? Could you use this indicator so that I can understand your orders ? {file}
Ignored
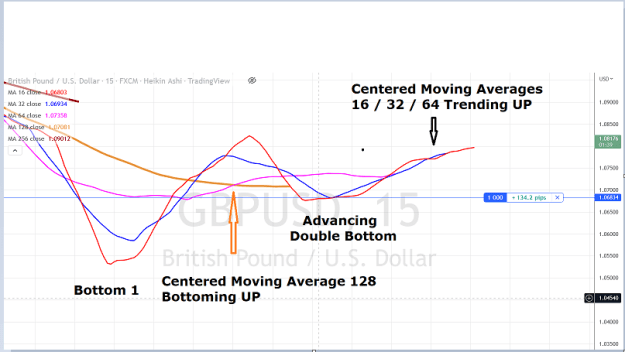
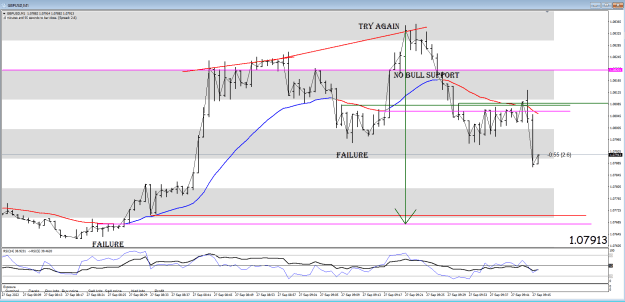
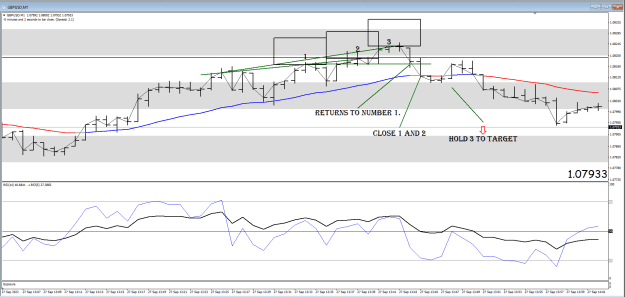
As I have said. This is a very volatile market and as such very risky, so the 1-minute chart is the safer option to trade with plenty of signals giving plenty of pips.
Just look at this little lot, well over 100 pips on a 1-minute chart.
Attached Image (click to enlarge)
Look how they are all the same, divergence, support and EMA target.
{quote} As I have said. This is a very volatile market and as such very risky, so the 1-minute chart is the safer option to trade with plenty of signals giving plenty of pips. Just look at this little lot, well over 100 pips on a 1-minute chart. {image} Look how they are all the same, divergence, support and EMA target.
Ignored
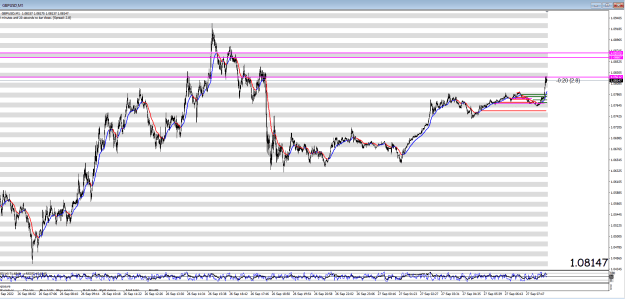
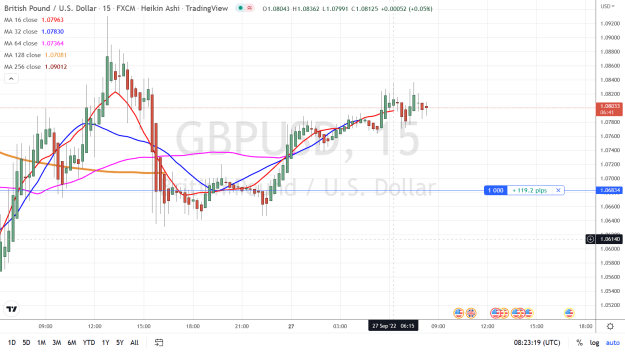
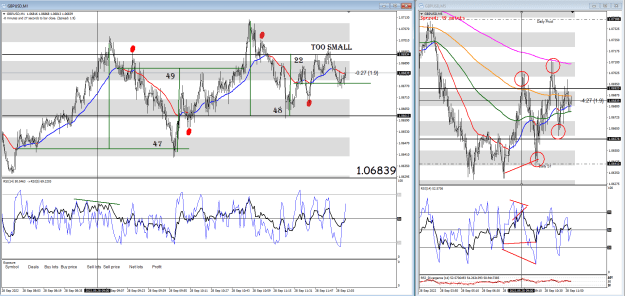
I think half the problem is deciding if the divergence is valid or not. That last run up on the M1 showed divergence on every up peak. Maybe the one at the top lined up with SR of some kind.
Can you please start your own thread with your posts and photos.
I am sure your method works , so please start your own thread and post your photos there. I am sure you will have many subscribers.
I have been a follower of the Cable swing thread for the past 3 years and most people who come here respect this thread and learn a lot from Alan's teachings.
This will help traders who like the Cable swing method focus on what Alan is teaching us on this thread.
{quote} I think half the problem is deciding if the divergence is valid or not. That last run up on the M1 showed divergence on every up peak. Maybe the one at the top lined up with SR of some kind. {image}
Ignored
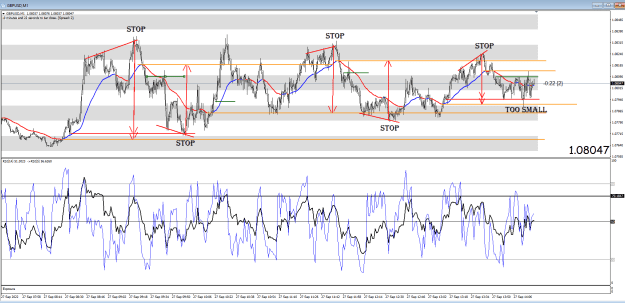
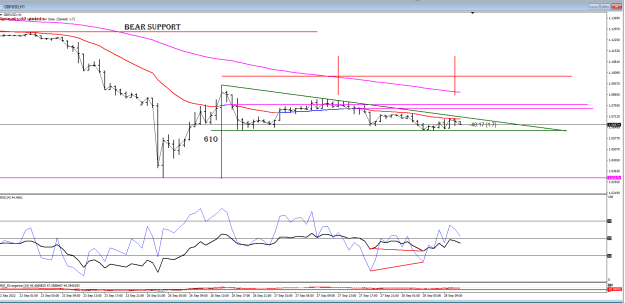
Look for where it breaks the swing high or low of the EMA
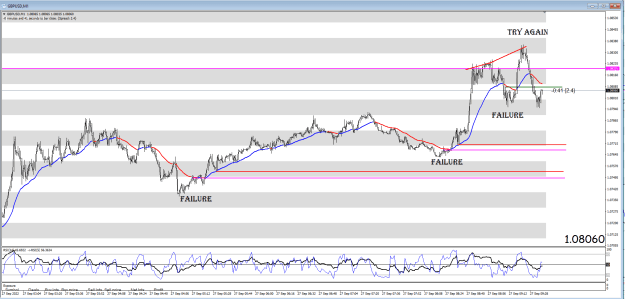
Hell of a day getting chopped up in the ranging of the asset. Finally managed to grab a +40 to bring the demo account Back to BE for the week. Keep at it guys.
Pay attention to the red dot Hooks. These are second chances to get in and price generally gets a wiggle on from there. {image}
Ignored
Dear Master,
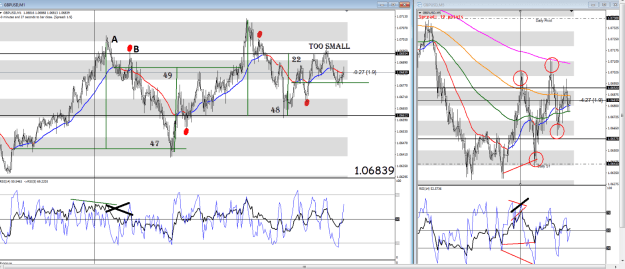
At red point B: you short because of bear RSI div on M1, bear RSI div on M5, hook figure and market at EMA 30 as resistence. Are there any other reasons to short at B ?
I have some questions:
1. why you don't short at A with bear regular div
2. And on M5 it seem we don't have bear RSI div
Well that big spike took me by surprise. Too quick to get my SL moved and then went and took my SL out. Dam UK government stepping in to buy Bonds to stabilize the markets.