• Home
  • Forums
  • Trades
  • News
  • Calendar
  • Market
  • Brokers
  • Login
  • Join
  • 8:06am
Menu
  • Forums
  • Trades
  • News
  • Calendar
  • Market
  • Brokers
  • Login
  • Join
  • 8:06am
Sister Sites
  • Metals Mine
  • Energy EXCH
  • Crypto Craft

Options

Bookmark Thread

First Page First Unread Last Page Last Post

Print Thread

Similar Threads

10 Ema and 200 Ema cross system 6 replies

EMA crossover (ema 14 & 34) 4 replies

Please help code an EMA Crossover 12ema x 24 ema cross 1 reply

EMA's and MA's confiming small time correctoin ema's crossing 1 reply

EMA Close Crossing EMA High/Low Help Please! 2 replies

  • Trading Discussion
  • /
  • Reply to Thread
  • Subscribe
  • 4
Attachments: Trading bias. Is 200 EMA a trap?
Exit Attachments
Tags: Trading bias. Is 200 EMA a trap?
Cancel

Trading bias. Is 200 EMA a trap?

  • Post #1
  • Quote
  • First Post: Edited 9:40am Aug 27, 2022 6:18am | Edited 9:40am
  •  GeldBaum
  • | Joined Jun 2021 | Status: Member | 11 Posts
Hello Folks,

Trend is your friend. Trade with the trend. Use 200 EMA for trend detection. Pretty common instructions...

I have been doing bit of research for trade bias filters as an algo/EA developer. I though I drop here one interesting finding of mine for discussion. Based on simple data collection test 200 EMA as trend filter seems to mostly be a trap !

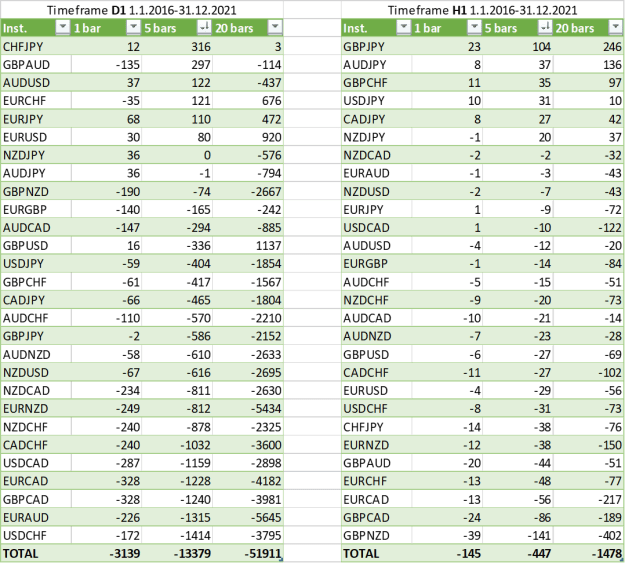
I made experiment where I simulate buy or sell on every bar (!) within time period of 1.1.2016-31.12.2021. Buy or sell decision is based on whether previous bar close was above or below 200 EMA. Then I simulated exit after 1, 5 and 20 bars and recorded profit or loss in points (without any spread). So basically random entry but with 200 EMA for bias and without trading costs.

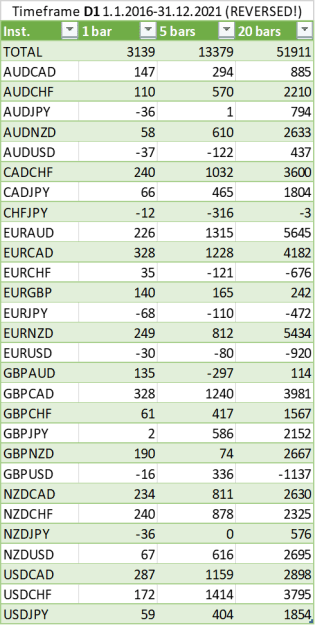
Results were that 200 EMA on average makes performance quite a bit worse. There is couple of currency pairs where it is beneficial (e.g. JPY pairs on H1 timeframe) but on average it was hurting performance and in many pairs it would make much more sense to trade against it. Mean reverting nature of FX...

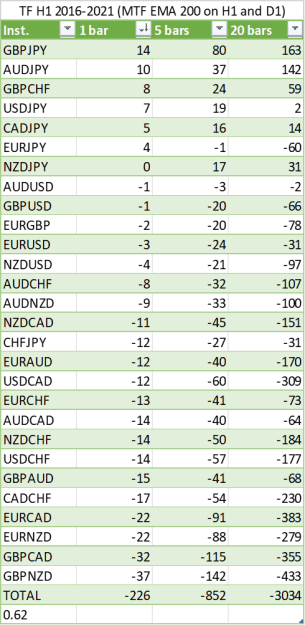
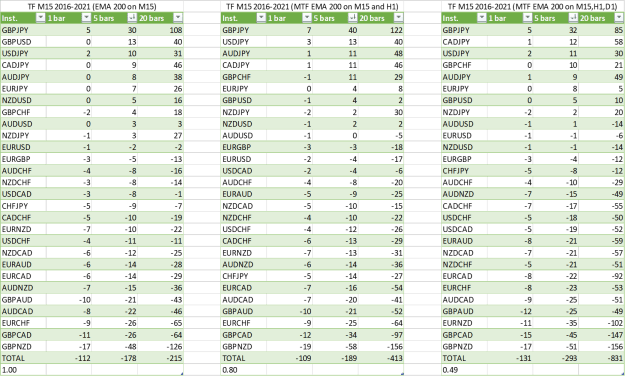
Attached is table with results for D1 and H1 bars and shows average amount of profit points for 1, 5 and 20 bars. Without bias filter assumed result would be 0. I have tested few other bias filters and durations etc and there clearly are better ones but I was sort of bit shocked how badly most common 200 EMA seems to work based on this kind of test.

Anyone with similar observations or some thoughts ? In case people are interested I might repeat same test but with some basic entry like MACD cross instead of every bar to see if 200 EMA looks bad also with such test.

Mika
{ email address deleted by staff }
Attached Image (click to enlarge)
Click to Enlarge

Name: screenshot.png
Size: 58 KB
  • Post #2
  • Quote
  • Aug 27, 2022 7:10am Aug 27, 2022 7:10am
  •  Maximilian80
  • | Joined Jan 2022 | Status: Member | 79 Posts
I’m really interested to see your further result on this technical tool! But personally I believe, it’s not a wise decision to rely on any kind of technical tool! Yeah, moving average is an important tool; but it’s not enough (individually)!
 
 
  • Post #3
  • Quote
  • Aug 27, 2022 1:17pm Aug 27, 2022 1:17pm
  •  Inthebox
  • Joined Jun 2010 | Status: Member | 10,404 Posts | Online Now
taking advantage of your experiments with EA, how about adding more time frames as further filters?
everything remains the same with the following multi time frames:
200 ema on:
1. D1, H1
2. D1, H1, M15
3. D1, H1, M5
4. D1, H1, M15, M5
ITB - Seeing Orderliness amongst 'Randomness'
 
 
  • Post #4
  • Quote
  • Aug 27, 2022 1:21pm Aug 27, 2022 1:21pm
  •  osfx
  • Joined Nov 2014 | Status: Member | 183 Posts
Hi Mika,
interesting study, as it confirms my observations, that mean reverting approaches usually work better in Forex (at least in algo trading).
I'm an algo trader too, and up to now I haven't been able to create a profitable strategy based on moving averages or enhance an existing stratgey by using them.
Generally indicators without a smoothing / averaging component work best for me in algo trading.
osfx.V13 (2022) All Time Return: 550.5%
 
1
  • Post #5
  • Quote
  • Aug 27, 2022 3:35pm Aug 27, 2022 3:35pm
  •  sina.keshawa
  • | Joined Aug 2020 | Status: Trader | 24 Posts
The oscillators work better for me as well than moving averages.
Sina
 
 
  • Post #6
  • Quote
  • Aug 28, 2022 2:27am Aug 28, 2022 2:27am
  •  WojakPips
  • | Joined May 2020 | Status: FXMember | 15 Posts
this time sell at uptrend, buy at downtrend. probably result will be the same
 
 
  • Post #7
  • Quote
  • Aug 28, 2022 5:46am Aug 28, 2022 5:46am
  •  K40
  • | Joined Apr 2009 | Status: Member | 344 Posts
pretty much lame light cable ...
 
 
  • Post #8
  • Quote
  • Aug 28, 2022 6:31am Aug 28, 2022 6:31am
  •  GeldBaum
  • | Joined Jun 2021 | Status: Member | 11 Posts
Quoting WojakPips
Disliked
this time sell at uptrend, buy at downtrend. probably result will be the same
Ignored
Reversed entries for quick test on D1 timeframe. This makes system have positive point expectation in average. Exactly opposite results to trading with the EMA. As assumed as I had no trading costs in place. So point saldo should be exact opposite.

Data looks like trading towards 200 EMA line would be overall better (at least with random entires!). There is some exception pairs and timeframes though.
Attached Image (click to enlarge)
Click to Enlarge

Name: screenshot.png
Size: 25 KB
 
 
  • Post #9
  • Quote
  • Aug 28, 2022 7:12am Aug 28, 2022 7:12am
  •  GeldBaum
  • | Joined Jun 2021 | Status: Member | 11 Posts
Quoting Inthebox
Disliked
taking advantage of your experiments with EA, how about adding more time frames as further filters? everything remains the same with the following multi time frames: 200 ema on: 1. D1, H1 2. D1, H1, M15 3. D1, H1, M5 4. D1, H1, M15, M5
Ignored
Did some of that. Here is simulate H1 trading with 200EMA on H1 and D1. Last number tells that 62% of bars EMAs were aligned and there was a simulated trade:
Attached Image (click to enlarge)
Click to Enlarge

Name: screenshot.png
Size: 23 KB
 
 
  • Post #10
  • Quote
  • Aug 28, 2022 7:15am Aug 28, 2022 7:15am
  •  GeldBaum
  • | Joined Jun 2021 | Status: Member | 11 Posts
Here is M15 simulation.
- First with 200EMA only on M15
- Second with 200EMA on M15 and H1
- Third with 200EMA on M15,H1 and D1

This makes me even more puzzled with these findings as I would have though MTF would improve results. But does not really seem so... Only JPY pairs follow somewhat 200 EMA and GBPJPY being most trending (this I already knew from other results...)
Attached Image (click to enlarge)
Click to Enlarge

Name: screenshot.png
Size: 83 KB
 
1
  • Post #11
  • Quote
  • Aug 28, 2022 7:25am Aug 28, 2022 7:25am
  •  WojakPips
  • | Joined May 2020 | Status: FXMember | 15 Posts
Quoting GeldBaum
Disliked
{quote} Reversed entries for quick test on D1 timeframe. This makes system have positive point expectation in average. Exactly opposite results to trading with the EMA. As assumed as I had no trading costs in place. So point saldo should be exact opposite. Data looks like trading towards 200 EMA line would be overall better (at least with random entires!). There is some exception pairs and timeframes though. {image}
Ignored
1:1 RRR ?
 
 
  • Post #12
  • Quote
  • Aug 28, 2022 7:40am Aug 28, 2022 7:40am
  •  GeldBaum
  • | Joined Jun 2021 | Status: Member | 11 Posts
Quoting WojakPips
Disliked
{quote} 1:1 RRR ?
Ignored
No SL and no TP so no RR target. Just recording profit or loss in points after 1, 5 and 20 bars. So basically simulating random entires with fixed trade duration of 1, 5 and 20 bars. Just to try to get general feel on quality of bias EMA200 provides.
 
1
  • Post #13
  • Quote
  • Aug 28, 2022 9:31am Aug 28, 2022 9:31am
  •  Inthebox
  • Joined Jun 2010 | Status: Member | 10,404 Posts | Online Now
Quoting GeldBaum
Disliked
This makes me even more puzzled with these findings as I would have though MTF would improve results. But does not really seem so... Only JPY pairs follow somewhat 200 EMA and GBPJPY being most trending (this I already knew from other results...) {image}
Ignored
me too. really surprised by the results.

if you do not mind, can you please also do one on the following:
1. TF m5 - mtf ema 200 on H1, M15, M5
2. TF m5 - mtf ema 50 on H1, M15, M5
3. TF m15 - mtf ema 50 on D1, H1, M15

just curious if the ema is adjusted smaller because we are working on the smaller time frames m15 and m5.
thanks for your time and effort.
ITB - Seeing Orderliness amongst 'Randomness'
 
 
  • Post #14
  • Quote
  • Aug 29, 2022 5:11am Aug 29, 2022 5:11am
  •  Erebus
  • Joined Jul 2011 | Status: Member | 7,408 Posts
You state that the 200 EMA is great for trend or direction bias, then you make a leap of faith and use that for an entry signal

Interesting hypothesis I guess

I read long ago that the theory behind the 200 SMA is based on the stock market.

You only have to Google for Death Cross to see examples and more theories.

Which was fine before computers and instant executions of the FX market.

So they changed to the EMA, and still fine for trend and direction IMHO.

On the longer term charts, naturally.
If you chase two rabbits, you will catch neither one!
Brain Surgery Return This Year: 20.9%
 
 
  • Post #15
  • Quote
  • Edited 6:15am Aug 31, 2022 5:29am | Edited 6:15am
  •  limprobable
  • Joined Jan 2012 | Status: Member | 564 Posts
Quoting GeldBaum
Disliked
Use 200 EMA for trend detection. I simulate buy or sell on every bar (!) within time period of 1.1.2016-31.12.2021. Buy or sell decision is based on whether previous bar close was above or below 200 EMA. Then I simulated exit after 1, 5 and 20 bars and recorded profit or loss in points (without any spread). So basically random entry but with 200 EMA for bias and without trading costs. {image}
Ignored
Your test has one and only one conclusion : your entries and exit are incorrect.

Green pips
Bottomless wonders spring from simple rules, which are repeated without end
 
 
  • Post #16
  • Quote
  • Aug 31, 2022 8:12am Aug 31, 2022 8:12am
  •  osfx
  • Joined Nov 2014 | Status: Member | 183 Posts
Quoting limprobable
Disliked
{quote} Your test has one and only one conclusion : your entries and exit are incorrect. Green pips
Ignored
Could you please explain your statement in more details?
osfx.V13 (2022) All Time Return: 550.5%
 
 
  • Post #17
  • Quote
  • Last Post: Sep 3, 2022 10:02am Sep 3, 2022 10:02am
  •  GeldBaum
  • | Joined Jun 2021 | Status: Member | 11 Posts
This was not even supposed to be a trading algorithm but just some data harvesting. So entry was random (every bar) as pointed above. Just simple study if price is typically going to the direction of the 200 EMA or not.

You can see major trends afterwards from EMA (it works for that...) but if you rely on its current value then price is more likely to revert towards 200 EMA it than continue going further. At least when looking over 28 pairs 2016- on every bar.

If extremes away from 200 EMA would be filtered out results might be better. When price is far from EMA its very likely to revert closer to it... Some band around 200 EMA might be where it works?

Also thinking about it if you are a institution trading big money then looking at 200 EMA gives you nowadays very good idea on direction most retails are trading... So you can use that info to play your game.

I have used my test method now for other trend bias indicators and there are ones which work way better and actually have positive expectancy in the same test... Although there is no apparent reason for that which is also surprise. 200 EMA just seems to be almost worst of all options I tested.

Wanted just to share the results as they surprised me. I recommend testing some algorithm you are backtesting anyway to trade towards EMA instead of away from it and see if you could see something similar. Especially for those pairs which seemed bad in my data. Like e.g. GBPCAD...
 
1
  • Trading Discussion
  • /
  • Trading bias. Is 200 EMA a trap?
  • Reply to Thread
0 traders viewing now
Top of Page
  • Facebook
  • X
About FF
  • Mission
  • Products
  • User Guide
  • Media Kit
  • Blog
  • Contact
FF Products
  • Forums
  • Trades
  • Calendar
  • News
  • Market
  • Brokers
  • Trade Explorer
FF Website
  • Homepage
  • Search
  • Members
  • Report a Bug
Follow FF
  • Facebook
  • X

FF Sister Sites:

  • Metals Mine
  • Energy EXCH
  • Crypto Craft

Forex Factory® is a brand of Fair Economy, Inc.

Terms of Service / ©2023