• Home
  • Forums
  • Trades
  • News
  • Calendar
  • Market
  • Brokers
  • Login
  • Join
  • User/Email: Password:
  • 3:31pm
Menu
  • Forums
  • Trades
  • News
  • Calendar
  • Market
  • Brokers
  • Login
  • Join
  • 3:31pm
Sister Sites
  • Metals Mine
  • Energy EXCH
  • Crypto Craft

Options

Bookmark Thread

First Page First Unread Last Page Last Post

Print Thread

Similar Threads

Harmonic trading-harmonic patterns 523 replies

Scripts for Limit entry, Stop entry, Market entry 46 replies

New pattern "harmonic flat" 96 replies

Harmonic pattern trading 28 replies

Harmonic Pattern Trading 3 replies

  • Commercial Content
  • /
  • Reply to Thread
  • Subscribe
  • 4,497
Attachments: Birth of New Trend Tipple Entry Harmonic Pattern Trading
Exit Attachments
Tags: Birth of New Trend Tipple Entry Harmonic Pattern Trading
Cancel

Birth of New Trend Tipple Entry Harmonic Pattern Trading

  • Last Post
  •  
  • 1 234235236237Page 238 239
  • 1 Page 238 239
  •  
  • Post #4,741
  • Quote
  • Aug 10, 2022 12:29pm Aug 10, 2022 12:29pm
  •  auto9817
  • | Commercial Member | Joined Aug 2008 | 9,352 Posts
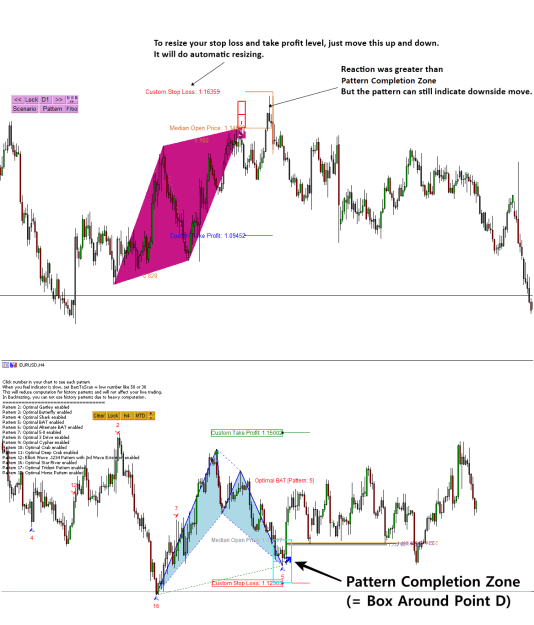
Mean Reversion Supply Demand – How to Remove Take Profit and Stop Loss Levels

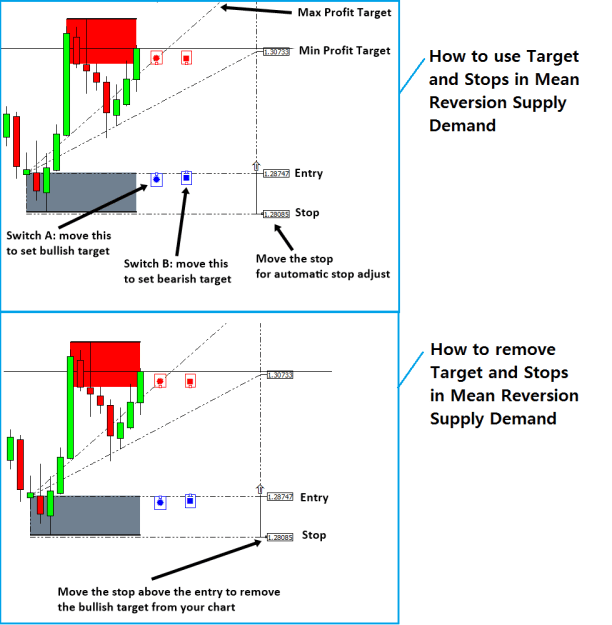
One of the greatest advantage of Mean Reversion Supply Demand is that it provide a flexible Profit and stop target for your trading. After you have learnt how to use this profit targets, now you want to learn how to remove them. Of course, there is a way to remove them. The trick is simply moving the stop text above the Entry text (for the case of buy). You will do the opposite for the case of sell. In the screenshot, the bottom image describe how to remove the targets from your chart.
There is another approach to remove take profit and stop loss targets. We provide the shortcut in keyboard for doing the same task. Simply hit “z” button in your keyboard. This will also remove the stop loss and take profit targets if you do not need them any longer.
https://www.mql5.com/en/market/product/16823
https://www.mql5.com/en/market/product/16851
https://algotrading-investment.com/p...supply-demand/

Attached Image (click to enlarge)
Click to Enlarge

Name: mean-reversion-supply-demand-mt4-screen-8120.png
Size: 27 KB
 
 
  • Post #4,742
  • Quote
  • Aug 11, 2022 4:05am Aug 11, 2022 4:05am
  •  auto9817
  • | Commercial Member | Joined Aug 2008 | 9,352 Posts
Introduction to Excessive Momentum Indicator

Momentum trading is often used by the experienced trader. One innovative way to use the momentum trading is to trade with the excessive momentum. Excessive momentum is the technique to identify unusually strong supply or unusually strong demand by analyzing the price series. Why do we need to care about the unusually strong supply or unusually strong demand in our trading? It is because unusually strong supply or unusually strong demand are the sign of the end of the current trend ( or birth of new trend). As you probably guess, when the new trend is born, you can ride the highest profit as possible. Hence, the excessive momentum can provide you the attractive entries for your trading.
Excessive Momentum Indicator provides you the ability to detect the excessive momentum in Forex and Stock chart. Let us start this simple introduction. Firstly, understand that the excessive momentum could possibly point out some anomaly movement or anomaly momentum in the market. To help your understanding, you can consider the insufficient momentum (i.e. exceptionally low volatility market or sideways market) as the opposite concept against excessive momentum. Our Excessive momentum indicator provides the automatic way of measuring the excessive momentum in your chart.
Once Excessive momentum is detected, then it will draw the Fibonacci Levels in the important area in your chart automatically. Then you can take this as your trading entry. It is simple and easy to trade. Most importantly, it is the powerful momentum indicator that alarm you the important trading entry and exit in advance.
https://algotrading-investment.com/p...tum-indicator/
https://www.mql5.com/en/market/product/30641
https://www.mql5.com/en/market/product/30621

You can watch this YouTube Video about this Excessive Momentum Indicator.
Youtube:
Inserted Video


You can read the full article: introduction to Momentum Trading. In this article, you will find how to unlock the potential of the excessive momentum trading. In addition, this article will provide you some introduction to Volume Spread Analysis.
https://algotrading-investment.com/2...entum-trading/


Attached Image (click to enlarge)
Click to Enlarge

Name: Excessive-Momentum-and-Fibonacci-Ratio-Analysis.png
Size: 31 KB
 
 
  • Post #4,743
  • Quote
  • Aug 11, 2022 11:40am Aug 11, 2022 11:40am
  •  auto9817
  • | Commercial Member | Joined Aug 2008 | 9,352 Posts
Price Action and Pattern Trading

Price Action, Price Pattern, and Chart Pattern are the direct price analysis used by many top trader in Forex and Stock market. After the intensive research in Forex and Stock market, we found the most powerful weapon is our own intuition or something close to our own intuition. We have ability to detect the risk and profitable opportunity and we are born with this ability naturally. Some people found the ways to transfer this ability for trading and investment. Some people still not have found the ways to use them yet for trading and investment. So what is this ability exactly ? or How to describe this ability in detail ? So you can understand and have some clue about the profitable trading. After removing all the technical language, if we have to say it one word, it is the human’s ability to interpret the geometry of the price. We are naturally born with the ability to recognize or to interpret the geometric pattern like a triangle, circle, squre, rectangle and so on. People often use this ability to interpret the geometry voluntarily and involuntarily to sense the risk and opportunity in our life. It is the same that a successful trader knows how to apply this ability in trading and investment.

Price Action, Price Pattern, and Chart Pattern are the technical language that transfer the ability to interpret the geometry in the financial trading. In another words, Price Action, Price Pattern, and Chart Pattern are the technical analysis that predict the financial market using the geometric pattern. Hence, technically, the price action and pattern trading is based on the pattern recognition ability, which is possessed by all human being. Pattern recognition is the most accurate weapon we have. We use them every day in our life. We use it to find out our friends, lover, enemy, good house, bad house, and so on. For forex and stock trading, this is also the precious weapon to select good stocks and bad stocks to trade. It is also used to predict potential bullish and bearish trend as well as to predict the turning point. Price patterns in charts are aligned with your intuition for your trading. Fortunately, we have made many trials and errors of using this price action, price pattern, and chart pattern in the market to find out the best practical application. Here is one secret of best trading practice.

The very essence of best trading practice come down to the words, “superimposed pattern”. That is to say, that you make trading decision based on multiple of patterns aligned in chart to get the highest accuracy as possible (=superimposed pattern trading). This follows the typical wisdom taught in many trading schools and textbooks, “trade with multiple evidences”.
Geometry and patterns are not rocket science. Anyone can understand and use them for your trading. Some example of superimposed pattern trading principle and some recipes are introduced in my book.

https://algotrading-investment.com/p...ttern-trading/

At the same time, Harmonic Pattern Scenario Planner is an excellent geometric pattern regognition tool that can predict the bullish and bearish turning point. Harmonic Pattern Scenario Planner is available in both MetaTrader 4 and MetaTrader 5 platform.

https://www.mql5.com/en/market/product/6101
https://www.mql5.com/en/market/product/6240
https://algotrading-investment.com/p...nario-planner/

Here is the great range of technical analysis package for your Price Action and Pattern Trading. We have developed many years to increase your trading performance. These technical analysis tools include the technical indicator, inter-market analysis tools and pattern scanner making the best use of Support, Resistance, Fibonacci Analysis, Harmonic Pattern, Elliott Wave, Supply Demand Analysis, Volume Spread Analysis and Market Volatility.

https://www.mql5.com/en/users/financeengineer/seller
https://algotrading-investment.com/t...xpert-advisor/
 
 
  • Post #4,744
  • Quote
  • Aug 12, 2022 10:04am Aug 12, 2022 10:04am
  •  auto9817
  • | Commercial Member | Joined Aug 2008 | 9,352 Posts
Elliott Wave Trend Tutorial 1

In this article, we will provide a simple tutorial for Elliott Wave Trend in Forex and Stock trading. Elliott Wave Trend is a good tool to identify the Elliott Wave Pattern in your chart. With some knowledge of Elliott Wave analysis, this tool get rid of a lot of manual wave analysis to save your time and effort. However, it can be more accurate through as it provides wave score for impulse wave and corrective wave. Elliott Wave Trend provides you a lot of features for your trading. Of course, many automatic analysis in Elliott Wave Trend is handy and convenient. Elliott Wave Trend consists of the following features:

  1. Turning point strength
  2. Turning Point strength Indicator for multiple time frame scanning
  3. Automatic Wave Analysis with Template and Pattern Approach
  4. Manual Wave Analysis with Template and Pattern Approach
  5. Wave Analysis saving and sharing System

This tutorial is not necessarily covering everything. But this tutorial will try to give some intuition over the automatic Wave Analysis. Automatic Wave Analysis is based on the template and pattern approach described in the book: Financial Trading with Five Regularities of Nature (Scientific Guide to Price Action and Pattern Trading).


Steps to perform the automatic wave analysis.

For Automatic Wave Analysis, you can only perform with Impulse and Corrective Waves.

  1. Click either Impulse or Correct button
  2. Click any wave template in the sub window (i.e. small blue and red circles).
  3. Click Draw Line button.
  4. Use either position rule or Wave Score to accept and to reject your analysis.
  5. Your trading will be based on the levels and turning point projected from your analysis.

Along with this article, you can have a look at this YouTube video about Elliott Wave Analysis. With this video, you will find more practical way of applying Elliott Wave for Forex and Stock trading.

YouTube Link:

Inserted Video


Here are the links for Elliott Wave Trend.

https://algotrading-investment.com/p...tt-wave-trend/
https://www.mql5.com/en/market/product/16479
https://www.mql5.com/en/market/product/16472

If you need more complete tutorial on Elliott Wave Analysis, visit this link:

https://algotrading-investment.com/2...g-performance/

When you want to set any trading alert after you wave analysis, you can use our free Auto Chart Alert.

https://algotrading-investment.com/p...o-chart-alert/
 
 
  • Post #4,745
  • Quote
  • Aug 13, 2022 5:05am Aug 13, 2022 5:05am
  •  auto9817
  • | Commercial Member | Joined Aug 2008 | 9,352 Posts
Optimized Harmonic Pattern

Have you ever thought that you could optimize the ratio of each Harmonic Pattern to improve your profit ? In real world trading, each currency or stock can behave differently with different dominating Fibonacci ratios. In addition, we can not assume that one harmonic pattern structure will work best across all currencies and stocks. Hence, there comes the idea of Optimizing the ratio of Harmonic Pattern. For example, you could modify or tune the ratio of Gartley Pattern, Butterfly Pattern, Bat Pattern, Crab Pattern, Cypher Pattern, 5-0 Pattern and so on for each currency or stock if you wish. Or you can modify or tune each Harmonic Pattern to get the overall performance better across all currencies and stocks. It is even better if you can apply the same idea when you trade with Elliott Wave patterns too.
To optimize each Harmonic pattern, you need a tool to visualize the true performance of each Harmonic Pattern through the historical data. It is better if you can see the historical performance directly from your chart without using any other complicated tools or tester or etc.

With X3 Chart Pattern Scanner, you can check the historical performance of Harmonic Pattern for any symbol immediately when you attach it to the chart. This sort of feature is very powerful but unique to X3 Chart Pattern Scanner. For example, You can not check the historical performance of Harmonic Pattern with repainting Harmonic pattern indicator. Since X3 Chart Pattern Scanner is non repainting, non lagging, synced between historical and live pattern, this is possible.
You can trade with optimized strategy in live trading. With X3 Chart Pattern Scanner, you can get the practical performance insight for each Harmonic pattern in few weeks with the historical information. This is really good to learn through your tool direclty and to trade with the same tool. Optimized Harmonic Pattern is a great way of improving your profit. With X3 Chart Pattern Scanner, you can modify or tune each Harmonic Pattern to optimize their trading performance using historical data. You can simply modify the ratio of each Harmonic Pattern in input setting. Below is the link to Non Repainting and Non Lagging Harmonic Pattern and Elliott Wave Pattern Indicator.

https://algotrading-investment.com/p...ttern-scanner/
https://www.mql5.com/en/market/product/41993
https://www.mql5.com/en/market/product/41992

This Youtube video will explain some features of X3 Chart Pattern Scanner, the non repainting, non lagging harmonic pattern and Elliott Wave pattern indicator.

Please watch the video to find out more about the non repainting Harmonic Pattern indicator.

YouTube:
Inserted Video

YouTube:
Inserted Video

YouTube:
Inserted Video


Attached Image (click to enlarge)
Click to Enlarge

Name: Profitable-Pattern-Scanner-new-update-is-coming.png
Size: 33 KB
 
 
  • Post #4,746
  • Quote
  • Aug 13, 2022 3:56pm Aug 13, 2022 3:56pm
  •  auto9817
  • | Commercial Member | Joined Aug 2008 | 9,352 Posts
Volatility Indicator List for Day Trading

Volatility indicator can help you to detect any statistical advantage for your trading. Especially, if you are trading with Price Action and Price Patterns, then we recommend to use the Volatility indicator together with your strategy. We provide the advanced volatility indicators for MetaTrader 4 and MetaTrader 5 platform.
Fibonacci Volatility Indicator
Fibonacci Volatility indicator can provide the market volatility in visual form in your chart for your trading. You can use Daily, Weekly, Monthly and Yearly Volatility for your trading. The most important application of this Volatility indicator is to detect the potential breakout area, potential bullish reversal area and potential bearish reversal area. When you want to visualize the Volatility for your trading, this is the best tool available in the market. Additionally, you can also use the Movable Volatility indicator too.

https://www.mql5.com/en/market/product/52671
https://www.mql5.com/en/market/product/52670
https://algotrading-investment.com/p...ity-indicator/

Harmonic Volatility Indicator

Harmonic Volatility indicator also provides the market volatility in visual form in your chart for your trading. This tool can be used to visualize the Daily, Weekly, Monthly and Yearly Volatility. The difference between Harmonic Volatility indicator and Fibonacci Volatility indicator is that you can only use Probability Configuration mode in the Harmonic Volatility indicator whereas in the Fibonacci Volatility indicator you can access both Probability Configuration and Z Score configuration. This is cheaper than Fibonacci Volatility indicator.
https://www.mql5.com/en/market/product/29008
https://www.mql5.com/en/market/product/29004
https://algotrading-investment.com/p...ity-indicator/

Double Harmonic Volatility Indicator

This is the cheapest Volatility indicator. This indicator is specialized in the Movable Volatility indicator mostly. Hence, if you only need the Movable Volatility indicator and you want to have more cost effective tool, then use this. However, if you want to have more choice in the Volatility visualization, then use either Harmonic Volatility indicator or Fibonacci Volatility indicator.
https://www.mql5.com/en/market/product/23779
https://www.mql5.com/en/market/product/23769
https://algotrading-investment.com/p...ity-indicator/

GARCH improved Nelder Mead – Free indicator

This is free Volatility indicator that implements the Generalized Autoregressive Conditional Heteroskedasticity (GARCH) methods with Nelder Mead algorithm. This is bit of experimental indicator to realize the GARCH (1,1) model. Hence, we provide this indicator for free. It would be interesting to see how this Volatility indicator works for your trading.
https://www.mql5.com/en/market/product/6918
https://www.mql5.com/en/market/product/6910
https://algotrading-investment.com/p...d-nelder-mead/


Attached Image (click to enlarge)
Click to Enlarge

Name: Volatility-Indicator-for-Day-Trading.png
Size: 35 KB
 
 
  • Post #4,747
  • Quote
  • Aug 14, 2022 10:32am Aug 14, 2022 10:32am
  •  auto9817
  • | Commercial Member | Joined Aug 2008 | 9,352 Posts
Introduction to Equilibrium Fractal Wave Analytics

EFW Analytics was designed to accomplish the statement “We trade because there are regularities in the financial market”. EFW Analytics is a set of tools designed to maximize your trading performance by capturing the repeating fractal geometry, known as the fifth regularity in the financial market. The functionality of EFW Analytics consists of three parts including:

1. Equilibrium Fractal Wave Index: exploratory tool to support your trading logic to choose which ratio to trade
2. Superimposed Pattern Detection as turning point analysis
3. Superimposed Channel for market prediction with Golden ratio expansion
4. Superimposed Channel for market prediction with whole number expansion
5. Equilibrium Fractal Wave (EFW) Channel detection
6. Superimposed Channel Rating (Higher rating = higher predictive power)

EFW Analytics provide the graphic rich and fully visual trading styles. In default trading strategy, you will be looking at the combined signal from Superimposed pattern + EFW Channel or Superimposed pattern + Superimposed Channel. In addition, you can perform many more trading strategies in a reversal and breakout mode. You can also run two different timeframes in one chart to enforce your trading decision. Sound alert, email and push notification are built inside the indicator.
Below is the link to the EFW Analytics:

https://algotrading-investment.com/p...ave-analytics/
https://www.mql5.com/en/market/product/27703
https://www.mql5.com/en/market/product/27702

Attached Image (click to enlarge)
Click to Enlarge

Name: efw-analytics-introduction-v1-2.png
Size: 82 KB
 
 
  • Post #4,748
  • Quote
  • Aug 15, 2022 4:28am Aug 15, 2022 4:28am
  •  auto9817
  • | Commercial Member | Joined Aug 2008 | 9,352 Posts
Smart Renko Chart

Renko chart is a popular tool to trade with the price action in Forex and Stock market. Renko Chart is the visualization technique, which does not use the fixed time interval but it uses the fixed price height. It is useful tool to recognize price action, price pattern and chart pattern from Forex and Stock chart. We created a powerful tool called Smart Renko for Price Action Trader. Here we will explain how to use Smart Renko Chart in brief. Smart Renko is a hybrid tool between renko chart and candlestick chart. Smart Renko provides the spread view of the renko bricks on the candle stick chart and then it also keeps the normal renko chart on the bottom. The advantage of Smart Renko is that you can use the analysis of renko chart together with the analysis of candlestick chart at the same time. You can get the best out of the both world.

The important point before using any Renko chart is about the brick height. This also appies to the Smart Renko Chart too. Just like normal renko chart, Smart Renko chart need to decide the good number for brick height. From my experience, you can the brick height near the 1 standard deviation. However, you must use the brick height in the round number because standard deviation might come in decimal numbers. So be sure to round up those decimal numbers into good integer numbers.
Another consideration is that your brick height should be in the factor of 10, 100 or 1000 pips for your trading. That means that using 5, 10, 20, 25, 50, 100, or 1000 brick height is the most effective price height for your trading. From my experience, these factored number can serve better for your brick height. If you do not choose sensible brick height, then you might not able to see anything on your charts. So be sure to choose the sensible brick height.

Finally do not forget that in Smart Renko, your analysis in Renko chart can be transferred to Main chart by double clicking over the Trend lines.
If you want to dig deeper, please google on renko chart. You will see a lot of articles about Renko charts and how to trade with them.

https://www.mql5.com/en/market/product/9911
https://www.mql5.com/en/market/product/9944
https://algotrading-investment.com/p...m/smart-renko/

In addition, some feature of Smart Renko is built inside the Price Breakout Pattern Scanner. Hence, you can use the automated Pattern Scanner together with Smart Renko Chart inside the Price Breakout Pattern Scanner. Price Breakout Pattener cotains two tools in one techncial indicator. In addition, Price Breakout Pattern Scanner provides the 52 Japanese candlestick patterns to assit your trading decision. Here are the links for the Price Breakout Pattern Scanner.

https://www.mql5.com/en/market/product/4859
https://www.mql5.com/en/market/product/4858
https://algotrading-investment.com/p...ttern-scanner/

YouTube Video about Smart Renko Chart

YouTube Link:
Inserted Video


Attached Image (click to enlarge)
Click to Enlarge

Name: Renko Chart.jpg
Size: 162 KB
 
 
  • Post #4,749
  • Quote
  • Aug 16, 2022 11:42am Aug 16, 2022 11:42am
  •  auto9817
  • | Commercial Member | Joined Aug 2008 | 9,352 Posts
Manual For Pairs Trading Indicator

Pair Trading Station is a powerful Pairs Trading Indicator that uses the correlation and spread analysis. Pairs trading is also known as the statistical arbitrage as it involves buying undervalued asset and selling overvalued asset at the same time. Pair Trading in Forex can be best described as taking the hedge position of buying and selling two highly correlated instruments at the same time. However, pairs trading can be used to predict the turning point. For example, it is possible to only take one buy or sell position only. When you take one position, you can use the pair trading signal as the primary confirmation and then you can use other secondary confirmation techniques to accomplish your trading decision. On the other hands, you can use the pair trading signal as the secondary confirmation techniques and then you can use your other technical or fundamental analysis as the primary confirmation. One thing you have to note here is that your other techniques to be used together with our pair trading signal should be based on the mean reversion trading because pair trading is based on the mean reversion trading principle too.
You can have a look at this manual from the link. This manual was written for Pairs Trading Station. This manual focuses on taking the hedging position between buying and selling two highly correlated instruments. The manual includes how to use the basic features of Pairs Trading station like buttons and input settings. In addition, it also teach you how to interpret the spread for your trading. As we have mentioned before, once you can interpret the spread, then you can combine the spread analysis with other secondary confirmation techniques.

https://algotrading-investment.com/2...g-station_ati/

In addition, you can watch this YouTube Video titled as How to use Pairs Trading Station

Inserted Video


Here is the landing page for Pairs Trading Station in MetaTrader 4 and MetaTrader5.

https://algotrading-investment.com/p...ading-station/
https://www.mql5.com/en/market/product/3303
https://www.mql5.com/en/market/product/3304

Attached Image (click to enlarge)
Click to Enlarge

Name: pair-trading-station-mt5-screen-2763.png
Size: 13 KB
 
 
  • Post #4,750
  • Quote
  • Aug 17, 2022 10:54am Aug 17, 2022 10:54am
  •  auto9817
  • | Commercial Member | Joined Aug 2008 | 9,352 Posts
Harmonic Pattern Indicator Explained

In this article, we will explain the type of Harmonic Pattern Indicator used for Forex and Stock trading. Firstly, there are several variations of Harmonic pattern indicators used by the trading community. Not all the harmonic pattern indicators are the same. The main variations of Harmonic pattern indicators can be categorized as following three different types depending on the algorithm used inside the indicator. Each type of Harmonic Pattern Indicator has its own pros and cons. We will go through each type of Harmonic Pattern Indicator in this article one by one. In addition, we will also discuss the hybrid of these three variations, called non repainting and non lagging Harmonic Pattern Indicator at the end of this article for your information.

Type 1: Non lagging (fast signal) but repainting – option to enter from turning point. Indicator does not show the failed pattern in chart and last pattern can repaint.
Type 2: Lagging (slow signal) but non repainting – no option to enter at turning point. Indicator does not show the failed pattern but last pattern does not repaint.
Type 3: Detecting pattern at point C but repainting – option to enter at turning point. Indicator detect pattern too early and you have to wait until the point D. Pattern may not achieve point D. Indicator does not show the failed pattern and last pattern can repaint.

Type 1. Non lagging (fast signal) but repainting

First type is non lagging but repainting harmonic indicators. This sort of Harmonic pattern indicator is the typical harmonic pattern indicators used by many traders. The advantage is that you do get the signal early as possible. You have an opportunity to trade from the turning point all the ways down to the continued trend. The disadvantage is that you are not able to test your strategy in chart because this type of harmonic pattern indicator does not show the entry of the failed patterns in chart but only successful one. In fact, Harmonic Pattern Plus and Harmonic Pattern Scenario Planner are under this category. They would provide the fastest signal but you will not able to test your strategy in your chart because they do not show the failed entry in chart.

Type 2. Lagging (slow signal) but non repainting

The second type is that lagging but non repainting. Some people use pretty words like minimal lag Harmonic pattern indicator or etc. But really lagging is just lagging. You can not make it really pretty though. As the literal meaning of lagging indicates, this type of harmonic pattern indicators provide you the lagging signal comparing to the first type. It will only provide you the signal after some times passed the turning point. Hence, you do not have an option to consider your entry from turning point. Depending on the pattern size, sometimes, the lagging can be only several bars but it can range up to several dozens of bars like 30 or 60 bars. Sometimes, your entry might be at the first reversal after the turning point. Hence you have be careful with this sort of entry. The advantage is that you will not experience repaint with the latest pattern though. I am not sure if non repainting property can offset the disadvantage of lagging signals because professional harmonic pattern traders are looking for the turning point entry.

You can read full article here. This article explains everything about Harmonic Pattern.

https://algotrading-investment.com/2...monic-pattern/

We will introduce several Harmonic Pattern Indicator based on what we have discussed so far in this article.

X3 Chart Pattern Scanner (Non Repainting + Non Lagging = Hybrid)

Below is the link to X3 Chart Pattern Scanner in MetaTrader 4 and MetaTrader 5 platform. X3 Chart Pattern Scanner is non repainting and non lagging Harmonic Pattern Indicator. In addition, each Harmonic Pattern in X3 Chart Pattern Scanner can be customized to improve trading performance. With tons of powerful features toward the day trading, this is the next generation Harmonic Pattern Indicator.

https://www.mql5.com/en/market/product/41993
https://www.mql5.com/en/market/product/41992
https://algotrading-investment.com/p...ttern-scanner/

In addition, we will introduce two Harmonic Pattern Indicator including Harmonic Pattern Plus and Harmonic Pattern Scenario planner. These Harmonic Pattern Indicator is repainting. However, they provide tons of powerful features at affordable price. Hence, if you do not mind the repainting Harmonic Pattern Indicator, then you can use these two tools. In addition, you can use X3 Chart Pattern Scanner together with Harmonic Pattern Plus or Harmonic Pattern Scenario Planner.

Harmonic Pattern Plus (Type 1)

Harmonic pattern plus is extremely good product for the price. With dozens of powerful features including Pattern Completion Interval, Potential Reversal Zone, Potential Continuation Zone, Automatic Stop loss and take profit sizing.

Below are the Links to Harmonic Pattern Plus

https://www.mql5.com/en/market/product/4488
https://www.mql5.com/en/market/product/4475
https://algotrading-investment.com/p...-pattern-plus/

Harmonic Pattern Scenario Planner (Type 1 + Predictive feature)

With additional features of predicting future harmonic patterns, this is very tactical harmonic pattern indicator with advanced simulation capability on top of the powerful features of harmonic pattern plus.

Below are the Links to Harmonic Pattern Scenario Planner

https://www.mql5.com/en/market/product/6101
https://www.mql5.com/en/market/product/6240
https://algotrading-investment.com/p...nario-planner/

Attached Image (click to enlarge)
Click to Enlarge

Name: harmonic-pattern-scenario-planner-mt4-screen-6990.png
Size: 21 KB
 
 
  • Post #4,751
  • Quote
  • Aug 18, 2022 10:22am Aug 18, 2022 10:22am
  •  auto9817
  • | Commercial Member | Joined Aug 2008 | 9,352 Posts
Japanese CandleStick Pattern with Price Pattern

Japanese candlestick pattern and price patterns like Triangle pattern, Falling Wedge, Rising Wedge, Double Top and Head and Shoulder patterns are often used to make buy and sell trading decision in Forex and Stock market. Have you ever thought using these two excellent patterns together for your trading ? Inside Price Breakout Pattern Scanner, you can access to the price patterns like Triangle, Falling Wedge, Rising Wedge, Double Top and Head and Shoulder patterns. At the same time, Japanese candle stick patterns are also built inside Price Breakout Pattern Scanner. This Japanese candlestick patterns are the kind of bonus feature for the trader who are using Price Breakout Pattern Scanner.
So what Japanese candlestick patterns can be detected with Price Breakout Pattern Scanner ? Including Doji Star, Hammer, Englufing, etc, you can asscess around 52 Japanese candlestick patterns. In Japanese candlestick inputs, you can switch on and off Candlestick pattern according to their type. For example, there are Japanese candlestick pattern made up from one candle bar, two candle bar, three candle bar, etc. You can switch on and off each according to your preference.
As a default setting, Pattern Name will be printed in chart. At the same time, you can bring your mouse over to each Japanese candlestick pattern to float pattern name in tool tip box (MT5 is more responsive than MT4 for this tool tip box) Alternatively, you can also change the angle of pattern name from horizontal to vertical or vice versa depending on your readability. In addition, we provide the YouTube Video for Price Breakout Pattern Scanner. With the video, you can see some basic operation of the price breakout pattern scanner. This video is applicable to both MetaTrader 4 and MetaTrader 5 platforms.
YouTube Video “How To Use Price Breakout Pattern Scanner”:
Inserted Video


Here is the link to the Price Breakout Pattern Scanner.
https://www.mql5.com/en/market/product/4859
https://www.mql5.com/en/market/product/4858
https://algotrading-investment.com/p...ttern-scanner/

Attached Image (click to enlarge)
Click to Enlarge

Name: Price Pattern with japanese candlestick patterns.png
Size: 48 KB
 
 
  • Post #4,752
  • Quote
  • Aug 19, 2022 4:34am Aug 19, 2022 4:34am
  •  auto9817
  • | Commercial Member | Joined Aug 2008 | 9,352 Posts
Winning Trading Logic – Detecting Supply and Demand Unbalance

As we have pointed out in our article, detecting the supply and demand unbalance is the most important key in making profits in Financial market. The excessive momentum indicator is the automated tool to detect these unbalance in supply and demand for your trading. With excessive momentum drawn in your chart, it is much easier to predict the timing of new trend and its direction.

Here is the insightful article explaining where the profits comes and how the profits are captured with the knowledge of excessive momentum. If you really want to make money in the market, must read this article. Reading does not cost you anything.

https://algotrading-investment.com/2...entum-trading/

This Excessive Momentum Zone can be considered as either Accumulation or Distribution area in the Volume Spread Analysis. You can further find the symptoms of accumulation and distribution area using our Volume Spread Pattern Indicator (Paid and Advanced version) or Volume Spread Pattern Detector (Free and Light version). You can watch the YouTube videos to find more about the Excessive Momentum Indicator.

YouTube Video Momentum Indicator:
Inserted Video


Here is link to Excessive Momentum Indicator available on MetaTrader 4 and MetaTrader 5 platform.

https://algotrading-investment.com/p...tum-indicator/
https://www.mql5.com/en/market/product/30641
https://www.mql5.com/en/market/product/30621

Attached Image (click to enlarge)
Click to Enlarge

Name: Excessive-Momentum-Indicator-with-Accumulation-and-Distribution-Area.png
Size: 32 KB
 
 
  • Post #4,753
  • Quote
  • Aug 20, 2022 4:22am Aug 20, 2022 4:22am
  •  auto9817
  • | Commercial Member | Joined Aug 2008 | 9,352 Posts
Generating Income with Chart Patterns

Profitable Chart Patterns include Fibonacci Price Patterns, Harmonic Patterns, Elliott Wave, X3 Chart Patterns as well as many other tradable patterns.
Chart Patterns are the good buy and sell signal generator for trading. It provides you the early signal at the turning point. Unlike other technical indicator, you are not lagging with these patterns. Hence you can always move ahead of other trader.
In addition, it is useful because it is extremely easy to combine with other analysis technique in your trading decision. In this short book, we provide the details of these chart patterns in Forex market with some practical tutorials.

In this book below, we explain how to make the best use of Chart Patterns for your trading. What is even better, we have included the bonus chapter of support and resistance.
Website links: https://algotrading-investment.com/p...-stock-market/

Below is the Harmonic pattern, Elliott Wave patterns and X3 pattern detection tools developed for MetaTrader, the most popular Forex Trading platform.

1. Harmonic Pattern Plus
One of the first automated Harmonic Pattern detection tool released in 2014. It can detect 11 most popular harmonic patterns with well-defined trading entries and stops. Pattern Completion Interval, Potential Reversal Zone and Potential Continuation Zone are supported. In addition, other dozens of powerful features are added like Japanese candlestick detection, etc. Because of affordable price, this harmonic pattern detection indicator is loved by many traders.
https://www.mql5.com/en/market/product/4488
https://www.mql5.com/en/market/product/4475
https://algotrading-investment.com/portfolio-item/harmonic-pattern-plus/

2. Harmonic Pattern Scenario planner
It is an advanced Harmonic Pattern indicator. On top of the features of Harmonic Pattern Plus, you can also predict future harmonic patterns through simulation. This is the tactical harmonic pattern tool designed for Professional harmonic pattern trader. Because of affordable price, this harmonic pattern detection indicator is loved by many traders.
https://www.mql5.com/en/market/product/6240
https://www.mql5.com/en/market/product/6101
https://algotrading-investment.com/portfolio-item/harmonic-pattern-scenario-planner/

3. X3 Chart Pattern Scanner
X3 Chart Pattern is our next generation Chart Pattern Scanner. This is non-repainting and non-lagging Harmonic Pattern Indicator. On top of that, this tool can detect Elliott Wave Pattern and X3 Chart Patterns. It can detect over 20 Chart Patterns. The bonus is that you can also detect around 52 Japanese candlestick patterns.
https://www.mql5.com/en/market/product/41993
https://www.mql5.com/en/market/product/41992
https://algotrading-investment.com/portfolio-item/profitable-pattern-scanner/

Attached Image (click to enlarge)
Click to Enlarge

Name: stop loss and take profit with harmonic pattern.png
Size: 41 KB
 
 
  • Post #4,754
  • Quote
  • Aug 20, 2022 12:51pm Aug 20, 2022 12:51pm
  •  auto9817
  • | Commercial Member | Joined Aug 2008 | 9,352 Posts
Showing Historical Patterns in X3 Chart Pattern Scanner

In trading, you get your profits as good as your tools and knowledge. X3 Chart Pattern Scanner is the superb Harmonic Pattern and Elliott Wave Pattern Indicator using the next generation pattern detection algorithm (The first Non Repainting + Non Lagging Harmonic pattern indicator.). To understand and to test your strategy, simply increase bars to scan to some higher number like 5000 or 10,000. Initially bars to scan is set to 250 to save some computation but you can increase as many as you can to just check your strategy. Screenshot shows how to do it.

1. Optimize your Strategy per symbol and per timeframe
As you can see, Harmonic Pattern and Elliott Wave pattern will perform differently per symbol and per timeframe. Hence, check history signals per symbol and per timeframe to optimize your strategy per symbol and per timeframe. While you are studying these patterns with Profitable Pattern scanner, you will gain more and more knowledge and skills for your trading.

2. Secondary Confirmation to improve your profits
To improve success rate, make sure that you are studying various indicators and filters together with the historical signal patterns in the scanner as secondary confirmation. In my opinion, you will gain practical knowledge within few weeks whereas other harmonic pattern trader takes typically 1 to 3 years to grab knowledge of harmonic pattern trading (and 2 to 4 years for Elliott wave trading). This is great advantage with this non repainting indicator.

3. Set Bars to Scan input = default in live trading to save computation
Another important note is that make the “Bars to Scan” input to 250 after you have finished your studying with historical signal patterns. If you leave Bars to Scan = 10,000, etc, this would be too heavy for your MetaTrader. For your live trading, set Bars to Scan = 250 or as small as possible. Since live trading results and historical signals are the same, you will not get lost anything even if you set Bars to Scan = 250 or other reasonably small number.

4. Simple and Easy to trade
Beside all this sophisticated technology running before your PC, trading with X3 Chart Pattern Scanner is easy and simple because of its non repainting features. Just study your charts and trade with what you see from your charts.

https://algotrading-investment.com/p...ttern-scanner/
https://www.mql5.com/en/market/product/41992
https://www.mql5.com/en/market/product/41993


Attached Image (click to enlarge)
Click to Enlarge

Name: Chart-Pattern-Scanner-Testing-Historical-Patterns-in-Your-Chart.png
Size: 64 KB
 
 
  • Post #4,755
  • Quote
  • Aug 21, 2022 11:32am Aug 21, 2022 11:32am
  •  auto9817
  • | Commercial Member | Joined Aug 2008 | 9,352 Posts
Great MetaTrader Indicator List

Here is the list of Great MetaTrader Indicators. Each technical indicator is designed to give you higher accuracy and better performance for trading in MetaTrader. The techncial indicators are based on Market Momentum, Harmonic Pattern, Elliott Wave, Chart Pattern, Support Resistance, Wave theory, Wyckoff Method, Pairs Trading and so on. We provide the short description and link to the product page for each MetaTrader indicator. We also include the link to Free MetaTrader indicators on the bottom of this page. Of course, all these MetaTarder Indicator can be found on mql5.com website too as well as our own website.

https://www.mql5.com/en/users/financeengineer/

1. Chart Pattern MT
Chart Pattern Scanner for auto detection of Triangle, Rising Wedge, and Falling Wedge Pattern, Double Top and so on for MetaTrader (MT4/MT5)
https://algotrading-investment.com/p...chart-pattern/

2. Harmonic Pattern Plus
Harmonic Pattern Indicator for Metatrader (MT4/MT5)
https://algotrading-investment.com/p...-pattern-plus/

3. Harmonic Pattern Scenario Planner
Harmonic Pattern Detection for Metatrader (MT4/MT5)
https://algotrading-investment.com/p...nario-planner/

4. X3 Chart Pattern Scanner
Non Repainting Harmonic Pattern and Elliott Wave Pattern Scanner for Metatrader (MT4/MT5)
https://algotrading-investment.com/p...ttern-scanner/

5. Mean Reversion Supply Demand
Supply/Demand Zone indicator to identify market equilibrium and inequilibrium on Metatrader (MT4/MT5)
https://algotrading-investment.com/p...supply-demand/

6. Price Breakout Pattern Scanner
Price Pattern Scanner to detect Triangle, Rising Wedge, and Falling Wedge Pattern, Double Top and so on for MetaTrader (MT4/MT5)
https://algotrading-investment.com/p...ttern-scanner/

7. Elliott Wave Trend
Elliott Wave Trend is a Elliott Wave indicator designed for turning point and trend analysis with Elliott Wave identification and prediction.
https://algotrading-investment.com/p...tt-wave-trend/


8. Excessive Momentum Indicator
Excessive Momentum Indicator is the momentum indicator designed to spot the slowing momentum directly from the chart.
https://algotrading-investment.com/p...tum-indicator/


9. Precision Support Resistance
Precision Support Resistance is the Support and Resistance Indicator for MetaTrader (MT4/MT5)
https://algotrading-investment.com/p...rt-resistance/


10. Equilibrium Fractal Wave Analytics
Equilibrium Fractal Wave Analytics is the Wave Indicator for MetaTrader (MT4/MT5) and it is based on Fractal Wave theory.
https://algotrading-investment.com/p...ave-analytics/


11. EFW Pattern Trader
EFW Pattern Trader is a Pattern Trader based on Harmonic Pattern and X3 Chart Pattern for Metatrader (MT4/MT5).
https://algotrading-investment.com/p...attern-trader/


12. Pair Trading Station
Pair Trading Station is the Pairs Trading indicator for MetaTrader (MT4/MT5). It is based on Pairs Trading Strategy.
https://algotrading-investment.com/p...ading-station/


13. Turning Point Detector
Turing Point Detector is the Turning Point Indicator for MetaTrader (MT4/MT5)
https://algotrading-investment.com/p...oint-detector/


14. Volume Spread Pattern Indicator
Volume Spread Pattern Indicator is the Wyckoff Method Indicator for MetaTrader (MT4/MT5) with supply and demand logic.
https://algotrading-investment.com/p...ern-indicator/


15. Harmonic Volatility Indicator
Harmonic Volatility indicator is the Market Volatility indicator on MetaTrader (MT4/MT5) applying Fibonacci Patterns to Volatility.
https://algotrading-investment.com/p...ity-indicator/


16. Other Free MetaTrader Indicators

You can also access the free MetaTrader indicators from below links:
https://algotrading-investment.com/p...category/free/

Attached Image (click to enlarge)
Click to Enlarge

Name: harmonic volatility indicator with double top.png
Size: 17 KB
 
 
  • Post #4,756
  • Quote
  • Aug 22, 2022 9:29am Aug 22, 2022 9:29am
  •  auto9817
  • | Commercial Member | Joined Aug 2008 | 9,352 Posts
Profitable Patterns in Financial Market

We have dicussed the predictive power of pattern to predict turning point. In this article, we will discuss the profitable patterns in Forex and Stock market. Price is the data recorded by financial exchange. The financial exchange distributes this real time price to trader electronically during market hours. Then trader will make buy or sell decision depending on their perception of the latest price. If they feel the price is low, then they will buy the currency or stock. If they feel price is too high, then they will sell the currency or stock. Once thing we need to know is that diversified reactions exists about good buying and selling price. We can have millions of different opinions about 200 dollar stock price for Facebook today. Some people will think that 200 dollar is good price to buy and some people will think the opposite. Some people might be neutral. Next price of Facebook will be determined by trading volume of buy and sell orders. If buy-trading volume is dominating over the sell-trading volume, then price will go up. If sell-trading volume is dominating over the buy-trading volume, then price will go down. You can think that each price recorded is in fact the record of the crowd reaction.
For our analysis, financial exchange also records the series of price in regular time interval like hourly, daily, or weekly, etc. Sometimes they record tick-by-tick data. They electronically store these historical data and distribute them to traders. Then trader uses these historical data to draw chart for further analysis of the price. In modern electronic trading environment, it is very rare to make buy and sell decision without looking at chart. Price series contain complex information. If we want to find out any useful information from price series, then we need to work backwards from price series into whatever information we need to seek. Extracting useful information from price series typically requires some mathematical tools.
Depending on what is our question, we need to apply different tools to exam price series. For example, if you want to know the common statistics for Facebook stock price, then you can calculate the mean, median, and standard deviation of the price series. If you want to find out good cycles to trade, then you need to apply Fourier transformation or some sort, to extract the cycles of Facebook price series. Likewise, if we want to find out profitable patterns, then we need to apply Peak Trough transformation or some sort to the price series. When we apply Peak Trough Transformation, we turn price series into the infinitely repeating triangles, which are called Fractal wave. Typically, Zig Zag indicator and Renko chart are used to turn price series into fractal wave.
Fractal or Fractal wave is commonly observable in nature like snowflake, in tree leaves, in heartbeat rate, in coastal line. Hence, many traders believe that the identifying profitable patterns in price series are the same as spotting natural order. By definition, Fractal wave is infinitely repeating self-similar patterns in time domain. The main regularity in Fractal wave is the shape of the pattern. Typically, this shape of pattern is referenced for some geometric shapes like triangle, circle, square, etc. In Fractal wave, we can have both strict self-similar and loose self-similar patterns. If the repeating patterns have the same geometric shape and all individual patterns have matching parameters in that shape, we call this as strict self-similarity. If repeating patterns have the same geometric shape but majority of individual patterns have non-matching parameters in that shape, then we call this as loose self-similarity. Fractal wave in Forex and Stock market price series have triangle as the geometric shape. However, individual triangle can be wider, narrower, longer, and shorter than other triangles. Hence, Fractal Wave in Forex and Stock market data possess the loose self–similarity. Loose self-similarity does not mean that all the triangles are non-identical in shape. Even in loose self-similarity, we can have some triangles in identical shape or at least within allowed range in precision.
First important characteristic of fractal wave is the infinite scales. In theory, repeating triangles in forex and stock market can have infinite variation of scales from very small to extremely large triangles. For example, one day we can observe one triangle formed in thirty seconds but another triangle can be formed in thirty days. In our pattern study, scale is an independent factor from geometric shape. As long as triangles are identical in shape, or within allowed range in precision, triangle formed in thirty seconds is treated as identical to the triangle formed in thirty days, regardless of their size. For some practical example, Fibonacci price pattern with 61.8% retracement formed in twenty-candle bar in hourly timeframe is an identical pattern to the other 61.8% retracement pattern formed in thirty six candle bar in daily timeframe.
Second important characteristic about Fractal wave pattern is that many small pattern are jagged together to make bigger patterns. For example, in triangular fractal wave as in financial market, bigger triangle will be made from many small triangles. In our pattern study, we often seek this sort of jagged patterns for our trading opportunity. Especially, in Harmonic pattern, Elliott Wave patterns, and X3 patterns, this sort of jagged pattern are commonly utilized to find the profitable patterns with good success rate.

Supply Demand Analysis is based on Fractal geometry of the market. Hence, it makes use of Peak and Trough analysis. You can use Ace Supply Demand Zone Indicator in MetaTrader to accomplish your pattern analysis. Ace Supply Demand Zone indicator is non repainting and non lagging supply demand zone indicator with a lot of powerful features built on.
https://www.mql5.com/en/market/product/40076
https://www.mql5.com/en/market/product/40075
https://algotrading-investment.com/p...y-demand-zone/


Attached Image (click to enlarge)
Click to Enlarge

Name: harmonic volatility indicator with double top.png
Size: 17 KB
 
 
  • Post #4,757
  • Quote
  • Aug 23, 2022 3:59am Aug 23, 2022 3:59am
  •  auto9817
  • | Commercial Member | Joined Aug 2008 | 9,352 Posts
Support and Resistance with Elliott Wave

Elliott Wave Trend is a Elliott Wave indicator for Elliott Wave Analysis. In addition, Elliott Wave Trend can produce its own support and resistance automatically for your trading. These support and resistance are detected by projecting the location of superimposed wave patterns. The produced support and resistance are accurate. By clicking the box, you can extend or reverse the support and resistance zone in your chart.

For your information, the support and resistance zone can be used on their own. Typically you will use the latest support and resistance in your trading decision. This is most basic use of these support and resistance. However, you can also use these support and resistance combined with your actual Elliott Wave counting. You can use the support and resistance to gauge the turning point and breakout using your Elliott Wave counting.

Elliott Wave Trend is powerful and sophisticated Elliott Wave indicator for professional trader. We provide many articles on how to use Elliott Wave Trend. We will introduce three articles for your information here.
In this article, we will provide some basic features available in Elliott Wave Trend. In addition, this article provide the really simple guide to Automatic Wave Analysis for Impulse and Corrective Waves.
https://algotrading-investment.com/2...nd-tutorial-1/
In this article, we provide the more detailed guide for automatic wave analysis for impulse and corrective waves. In addition, this article provide a demonstration of using automatic wave anlaysis so that you can improve your trading performance.
https://algotrading-investment.com/2...g-performance/
In this article, we provide some theoretical background behind Elliott Wave Analysis. In addition, the article explains the way to improve the accuracy of your market prediction with Elliott Wave Analysis.

https://algotrading-investment.com/2...-elliott-wave/

Here is the link to the Elliott Wave Indicator:
https://www.mql5.com/en/market/product/16479
https://www.mql5.com/en/market/product/16472
https://algotrading-investment.com/p...tt-wave-trend/


Attached Image (click to enlarge)
Click to Enlarge

Name: Elliott-Wave-Trend-Support-and-Resistance-Zone.png
Size: 32 KB
 
 
  • Post #4,758
  • Quote
  • Aug 23, 2022 3:37pm Aug 23, 2022 3:37pm
  •  auto9817
  • | Commercial Member | Joined Aug 2008 | 9,352 Posts
Turning Point in Financial Market

Meaning of turning point is a point at which a significant change occurs. In financial market, the turning point refers to a point at which the trend direction changes. Profitable pattern is the technical analysis to detect the turning point of the financial market. We have shown that fractal wave is our specialized microscope in studying the profitable patterns in the financial market. Then you might be curious why turning points or zigzag price patterns happen fundamentally. This is an important question in our trading. The short answer is that people do not like to see price deviated too far from the fundamentals. Too far might be not the precise word. Too far indicates the extreme deviation. In statistical sense, this often indicates the case outside 95% confidence interval or higher. Let us illustrate some fundamentals that can make up the turning point in general sense.
The first fundamental example is earning of the company. Earning is the one of the most important fundamental that investors use to make the perception of the financial performance of the company. Hence, many of us use earning to buy or sell the stocks. If a stock price is too high over the earnings of the company (i.e. Price to Earning), this can create a turning point due to some sell pressure against recent buy trend. Likewise, if a stock price is too low over the earnings of the company (i.e. Price to Earning), this can create a turning point due to some buy pressure against recent sell trend.
Another fundamental example is that individual stock price tends to follow the index of the stock market. For example, Stock price of Amazon will follow S&P 500 index up to some degree depending on its market beta. If Stock price of Amazon is deviated too high from S&P 500 index, then this can create a turning point due to some sell pressure against recent buy trend. Likewise, if stock price of Amazon is deviated too low from S&P 500 index, then this can create a turning point due to some buy pressure against recent sell trend.
Now let us take some example from Forex market. EURUSD and AUDUSD are highly correlated. High correlated means that this two currency pairs often move together in the same direction. However, there are the cases that these two currency pairs can move in opposite direction for some notable period. If EURUSD is deviated too high from AUDUSD, then this can create a turning point due to some sell pressure for EURUSD against its recent buy trend. Likewise, if EURUSD is deviated too low from AUDUSD, then this can create a turning point due to some buy pressure for EURUSD against its recent sell trend. In fact, this is the basis of the Pairs trading strategy or Statistical arbitrage strategy.

You can continue to read full article here from the link below. This article will explains everything about "Fibonacc Chart Pattern". It is free but informative article.
https://algotrading-investment.com/2...urning-points/

You can also use X3 Chart Pattern Scanner in MetaTrader to predict the turning point. Here is the product page for the X3 Chart Pattern Scanner. Enjoy the powerful non repainting and non lagging Harmonic Pattern and Elliott Wave Pattern indicator.
https://www.mql5.com/en/market/product/41993
https://www.mql5.com/en/market/product/41992
https://algotrading-investment.com/p...ttern-scanner/


Attached Image (click to enlarge)
Click to Enlarge

Name: Pattern Completion Zone in Harmonic Pattern.png
Size: 20 KB
 
 
  • Post #4,759
  • Quote
  • Aug 25, 2022 4:39am Aug 25, 2022 4:39am
  •  auto9817
  • | Commercial Member | Joined Aug 2008 | 9,352 Posts
Harmonic Pattern Plus and X3 Chart Pattern Scanner

Harmonic Pattern Plus and X3 Chart Pattern Scanner are the great Harmonic Pattern Indicator if you are looking for good Harmonic Pattern Indicator. However, you might want to know what are the difference between them because their price is different too. Here is some information about both Harmonic Pattern indicators.
Firstly, in Harmonic Pattern Plus, you can only detect Harmonic Patterns. This means Harmonic Pattern Plus does not support Elliott Wave pattern or other chart patterns. If you are looking for the Harmonic Pattern indicator, most of time this should be not a problem. Harmonic Pattern Plus comes at affordable price but it is a repainting Harmonic Pattern indicator. As we have explained in this article below, most of Harmonic Pattern indicator is repainting. Hence, many Forex trader do not mind to use such a Harmonic Pattern Indicator.

https://algotrading-investment.com/2...tor-explained/

In fact, this Harmonic Pattern indicator is still loved by many Forex trader because it provides tons of powerful and essential features to generate accurate trading signals at this affordable price. For example, it comes with Japanese candlestick patterns and channel detection features, which helps to improve the accuracy of Harmonic Pattern Trading. The same facts apply to Harmonic Pattern Scenario Planner too. However, Harmonic Pattern Scenario Planner is more advanced than Harmonic Pattern Plus as it provides the predictive features on top of all the functionality of Harmonic Pattern Plus. Hence, if you are a tactical trader, then we will recommend using Harmonic Pattern Scenario Planner instead of Harmonic Pattern Plus.

Now, let us talk about X3 Chart Pattern Scanner. In X3 Chart Pattern Scanner, it can detect Harmonic Patterns + Elliott Wave Patterns + X3 Chart Patterns. The ability to use Elliott Wave patterns and X3 Chart patterns can definitely provide you more trading opportunity. On top of this advantage, X3 Chart Pattern Scanner is a non repainting and non lagging Harmonic Pattern Indicator. Hence, this is a useful to any level of trader from beginner to experienced. In X3 Chart Pattern Scanner, you can even tune or modify each pattern to maximize your trading performance. For example, you can construct any Harmonic pattern or Chart pattern using the notation of retracement and expansion as outlined here.

https://algotrading-investment.com/2...able-patterns/

As you can tell, X3 Chart Pattern Scanner is a very powerful Harmonic Pattern Indicator with the robust trading technology. In addition, this indicator comes with Japanese candlestick patterns and advanced channel detection. If you wish, you can use both Harmonic indicator together because both Harmonic indicator are based on the different pattern detection algorithm. They often spot the harmonic pattern in the different market timing.

Below are the Links to X3 Chart Pattern Scanner
https://www.mql5.com/en/market/product/41993
https://www.mql5.com/en/market/product/41992
https://algotrading-investment.com/p...ttern-scanner/

Below are the Links to Harmonic Pattern Plus
https://www.mql5.com/en/market/product/4488
https://www.mql5.com/en/market/product/4475
https://algotrading-investment.com/p...-pattern-plus/

Below are the Links to Harmonic Pattern Scenario Planner
https://www.mql5.com/en/market/product/6101
https://www.mql5.com/en/market/product/6240
https://algotrading-investment.com/portfolio-item/harmonic-pattern-scenario-planner/

Attached Image (click to enlarge)
Click to Enlarge

Name: stop loss and take profit with harmonic pattern.png
Size: 41 KB
 
 
  • Post #4,760
  • Quote
  • Aug 26, 2022 5:56am Aug 26, 2022 5:56am
  •  auto9817
  • | Commercial Member | Joined Aug 2008 | 9,352 Posts
Reusing Supply Demand Zone

Here is a short article to increase your profitability by reusing supply and demand zone for Forex and Stock Market Trading. As we provide non repainting supply and demand zone now, naturally we are able to monitor the price action around historical supply demand zone too. What does this mean ? Firstly if you are using fresh supply demand zone only, then you might skip to read this article. It is entirely your choice. However, we observe that historical supply and demand zone is still important in our trading.

Consider the screenshot below. We have picked up one historical supply zone. This supply zone was penetrated already and people may not have an interest in reusing this historical supply zone. Hence, this supply zone was no longer fresh. However, we can see that market is respecting this historical supply zone making good price action around this supply zone. Check out how many times the price was reversed at this historical supply zone. Price was reversed almost four times making nice price trajectory. After it was visited three time, it provides one crucial trading opportunity at the fourth touch. Even this supply zone is not fresh, it is possible to make good money by using this supply zone as resistance line.
Here is simple rules in using historical supply or demand zone.

  1. You can use historical supply or demand zone if there is no fresh supply or demand zone to trade.
  2. You can use supply zone like the resistance assuming they are respected by the market.
  3. You can use demand zone like support assuming they are respected by the market.
  4. Choose the supply or demand zone, which is most repected by the market to trade. You can check this by how many times the price visited this supply or demand zone.
  5. Do the risk management with the zone if your entry is decided.

At the end of day, supply demand zone can be considered as the advanced support and resistance. In the support and resistance, we commonly use historical support and resistance as long as they are respected by market. Likewise, I have just demonstrated the way of using historical supply and demand zone in similar manner. As I mentioned, if your strategy is purely based on using fresh supply demand zone, you do not have to take this advice from this article because it is also one estabilished strategy to trade in supply and demand zone trading. For example, you can read this article below to find out how to trade with the fresh suppy and demand zone using four price patterns incluidng drop base rally, rally base drop, Rally base rally, and drop base drop.
https://algotrading-investment.com/2...mand-analysis/

If you need a detailed guide to trade with supply and demand zone, then you can read the book: Technical Analysis in Forex and Stock Market (Supply Demand Analysis and Support Resistance). This book will explain the trading strategy with fresh supply demand zone as well as historical supply and demand zone.
https://algotrading-investment.com/p...-stock-market/

Here is the link to Ace Supply Demand Zone Indicator, which is the non repainting supply demand zone with tons of powerful features to trade. Many professional Forex Trader uses Ace Supply Demand Indicator as their primary technical analysis tool.
https://www.mql5.com/en/market/product/40076
https://www.mql5.com/en/market/product/40075
https://algotrading-investment.com/p...y-demand-zone/


Attached Image (click to enlarge)
Click to Enlarge

Name: supply-demand-zone-like-support-resistance.png
Size: 21 KB
 
 
  • Commercial Content
  • /
  • Birth of New Trend Tipple Entry Harmonic Pattern Trading
  • Reply to Thread
    • 1 234235236237Page 238 239
    • 1 Page 238 239
0 traders viewing now
  • More
Top of Page
  • Facebook
  • Twitter
About FF
  • Mission
  • Products
  • User Guide
  • Media Kit
  • Blog
  • Contact
FF Products
  • Forums
  • Trades
  • Calendar
  • News
  • Market
  • Brokers
  • Trade Explorer
FF Website
  • Homepage
  • Search
  • Members
  • Report a Bug
Follow FF
  • Facebook
  • Twitter

FF Sister Sites:

  • Metals Mine
  • Energy EXCH
  • Crypto Craft

Forex Factory® is a brand of Fair Economy, Inc.

Terms of Service / ©2023