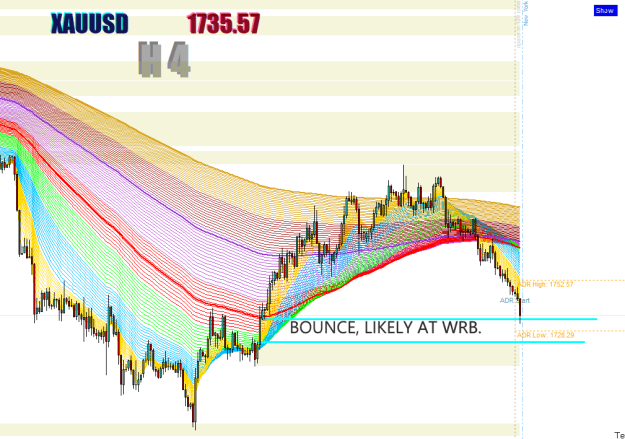
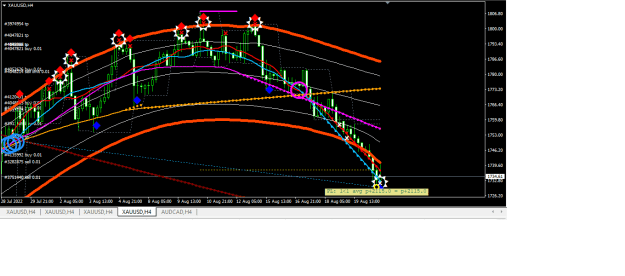
Disliked{quote} Here ya go aahmad, just put this on any chart /timeframe you like and will show you the hidden gaps(FVG's) https://www.forexfactory.com/attachm...6?d=1629905826.Ignored
Love for all; Hatred for none.
Disliked{quote} Here ya go aahmad, just put this on any chart /timeframe you like and will show you the hidden gaps(FVG's) https://www.forexfactory.com/attachm...6?d=1629905826.Ignored
Disliked{quote} Do you use hidden gaps for your trading? In H1 time frame , gaps are according to my targets.Ignored
Disliked{quote} Hi aahmad, yes i do, just another tool in the box, i like to think of them as area's of interest, i have them on every timeframe( i only trade gold). After a while you'll begin to see how the market reacts to them, it will either use them as support and resistance, or it will use them to build up an order block, or it will take it, usually right to the pip, stop and then reverse. I keep an eye on them because they are easy to see, and when one is taken that's when i take notice of what price is doing. Leave them on your charts for while...Ignored
Disliked{quote} hi chipsngravey can you tell clearlier about the longer timeframes take longer to fill, but the BIG ALGO's never forget them, im just trade gold a few months ago, i used to trade EU and i think i'll gradually forward to gold edit: im only trade h4/h1Ignored
Disliked{quote} Journey begins Trade 1. Sell 1751 - 1730 3000 points to go. Target = 5000 points out of 10 positions {image}Ignored
Disliked{quote} Hi Wendy, yes it's quite simple really mate, put the indicator 0n a few timeframes from 1/5 min to 1/4 hr and you'll see. The big players algo's don't like gaps so they will always fill them at some point, but the higher timeframes usually take longer to fill, sometimes weeks/months on a daily timeframe. Put the indi on a daily timeframe and look at yesterday and you'll see what i mean, look where price stopped almost to the pip! P.S - if your new to gold i recommend checking out AUSSIE's thread, lots of really good traders on there with...Ignored
DislikedPin bar at H4 SMA200. If this level broke then next target is SMA200 in H1 @1767. {image} {image}Ignored
Disliked{quote} Very nice charts, thanks for sharing, big learning point for me! Do you trade XAG/USD or have an analysis for it as well? Thank you.Ignored
Disliked{quote} Hi Wendy, yes it's quite simple really mate, put the indicator 0n a few timeframes from 1/5 min to 1/4 hr and you'll see. The big players algo's don't like gaps so they will always fill them at some point, but the higher timeframes usually take longer to fill, sometimes weeks/months on a daily timeframe. Put the indi on a daily timeframe and look at yesterday and you'll see what i mean, look where price stopped almost to the pip! P.S - if your new to gold i recommend checking out AUSSIE's thread, lots of really good traders on there with...Ignored
Dislikedsold from 1753, stop above 1767, target is 1721 and below {image}Ignored
DislikedPin bar at H4 SMA200. If this level broke then next target is SMA200 in H1 @1767. {image} {image}Ignored
Disliked{quote} 1. Sell 1751 - 1730 2. Buy 1743 - 1753 2000 points to go. Target = 5000 points out of 10 positions {image}Ignored
Dislikedsold from 1753, stop above 1767, target is 1721 and below {image}Ignored