• Home
  • Forums
  • Trades
  • News
  • Calendar
  • Market
  • Brokers
  • Login
  • Join
  • User/Email: Password:
  • 4:42pm
Menu
  • Forums
  • Trades
  • News
  • Calendar
  • Market
  • Brokers
  • Login
  • Join
  • 4:42pm
Sister Sites
  • Metals Mine
  • Energy EXCH
  • Crypto Craft

Options

Bookmark Thread

First Page First Unread Last Page Last Post

Print Thread

Similar Threads

5-min PASS (Price Action Scalper System) 2,932 replies

The Scalper Setup 28 replies

Price pattern scanner where I choose the pattern 4 replies

5-min PASS (Price Action Scalper System) SIGNAL 11 replies

Need a good Metatrader broker for a scalper system 14 replies

  • Commercial Content
  • /
  • Reply to Thread
  • Subscribe
  • 4,359
Attachments: Price Breakout Pattern Scalper EA For Free
Exit Attachments
Tags: Price Breakout Pattern Scalper EA For Free
Cancel

Price Breakout Pattern Scalper EA For Free

  • Last Post
  •  
  • 1 225226227228229 Page 230
  • 1 229 Page 230
  •  
  • Post #4,581
  • Quote
  • Aug 21, 2022 4:01am Aug 21, 2022 4:01am
  •  auto9817
  • | Commercial Member | Joined Aug 2008 | 9,352 Posts
Supply Demand Trading with Trendline

Introduction to Supply Demand Trading with Trendline

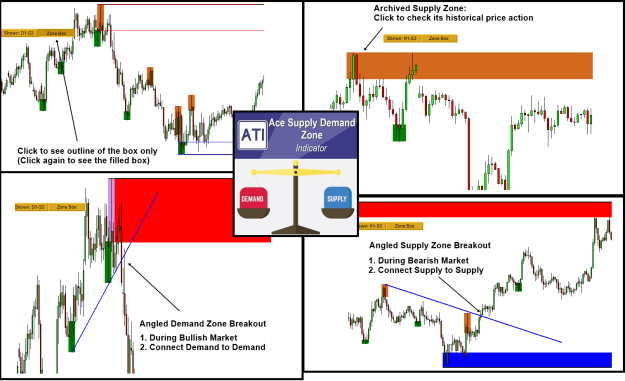
"Supply Demand Trading with Trendline" was formally known as the "Angled Supply Demand Zone Trading". Supply Demand Trading with Trendline is the advanced support and resistance trading in fact. The concept of "Supply Demand Trading with Trendline" was first developed by Young Ho Seo in 2019. In 2019, this technique was called "Angled Supply Demand Zone Trading". Hence, you can consider the supply demand trading with trendline and angled supply demand trading are identical. The essence of "Supply Demand Trading with Trendline" or "Angled Supply Demand Zone Trading" is to reuse the historical supply demand zones for some ingenious purpose. Please read this free article until to the end to master this trading strategy so that you can bring your trading skills to another level. As we have mentioned often, this trading strategy could be extra skills on top of the classic Supply Demand Trading.
If you are relying on trading income, good trading strategy is your workhorse for every day. Supply and demand zone concept is widely used among traders for several reasons. It is relatively simple to start with. In addition, it is effective in picking up the profitable moment. In fact, Supply and Demand zone is the extended concept from support and resistance at some points. The trading zone concept adds different values to our trading. For example, with zone, it is much easier to define our trading scenario and risk management than just simple price level from support and resistance. However, there is no perfect trading system in the world (i.e. being profitable and perfect is two different things). Of course, supply and demand zone concept has its own weakness too. For example, many traders still find it difficult to find good supply and demand zone to trade. Hence, some trader relies on the supply and demand indicator rather than the manual detection of the zone. Another difficulty is to find some good guide on how to trade with profits. It is difficult to find which online article is the genuine and profitable one.

You can continue to read full article here from the link below. This article will explains everything about "Supply Demand Trading with Trendline". It is free but informative article.
https://algotrading-investment.com/2...ng-tutorial-1/

Note about Supply Demand Trading with Trendline

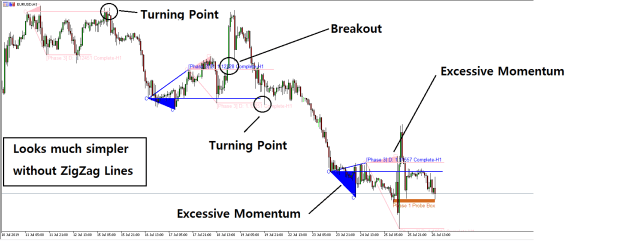
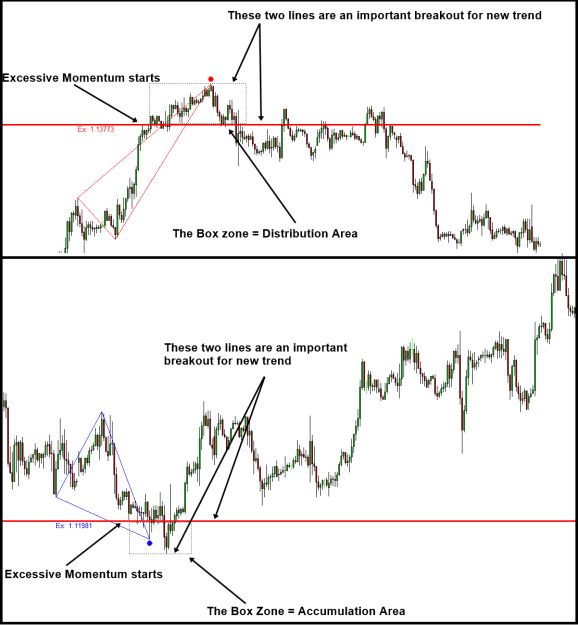
The good news about supply demand trading with trendline is that it does not alter the original concept of supply demand trading. However, it helps you to find more accurate supply and demand zone to trade. You can take the breakout through the angled line as the double confirmation of the direction of your supply and demand trading. Therefore, any supply and demand zone trader can use Angled supply demand trading on top of their typical trading setup. When you draw the angled line or trendline, you might take some guide from GANN’s FAN or GANN’s angle, but this is not compulsory. There are many ways you can draw the trendline using historical supply and demand zone. Please practice as it was shown in this article and then build up the logic and skill gradually.

Supply and Demand Indicator

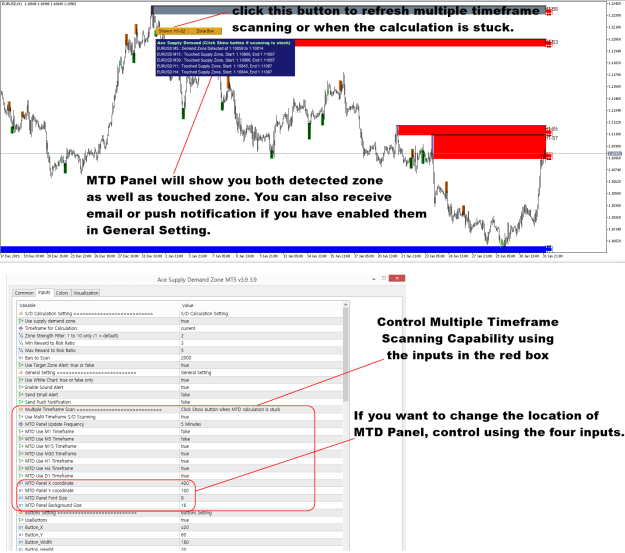
Ace Supply Demand Zone indicator was built upon non-repainting and non-lagging principle. It is multi-purpose Supply Demand Zone indicator for any level of trader. We especially built this Ace Supply Demand Zone indicator to improve the accuracy of supply and demand trading. This supply and deamnd indicator is available through several channels from below links.

https://www.mql5.com/en/market/product/40076
https://www.mql5.com/en/market/product/40075
https://algotrading-investment.com/p...y-demand-zone/

Attached Image (click to enlarge)
Click to Enlarge

Name: Scan-Supply-Demand-Zone-Across-All-Timeframe.png
Size: 80 KB
 
 
  • Post #4,582
  • Quote
  • Aug 22, 2022 4:14am Aug 22, 2022 4:14am
  •  auto9817
  • | Commercial Member | Joined Aug 2008 | 9,352 Posts
Non Repainting Supply Demand Indicator

Ace Supply Demand Zone is the non-repainting Supply Demand indicator. Supply Demand indicator automatically finds out the potential imbalance between supply and demand in Forex and Stock chart. Hence, supply demand analysis is very useful to trade with the market turning point. Its trading strategy is based on the price pattern detection like Drop-Base-Rally, Rally-Base-Drop and so on. However, you do not need to know the name of patterns as the supply demand analysis is mostly visual and intuitive. What you need to do is to open the chart and apply Ace Supply Demand Zone in the chart. Then you will see that the indicator detects the possible trading zone automatically. These trading zone looks alike support and resistance. Hence, some trader consider the supply demand zone as the advanced support and resistance. This trading zone is called supply zone when the trading zone is formed at peak. This trading zone is called deamnd zone when the trading zone is formed at trough. When the supply zone or demand zone is never touched, we call them as fresh supply and demand zone or virgine supply and demand zone. In addition, supply and demand zone is touched or broken in the past, then they are called historical supply and demand zone.
In Ace Supply Demand Zone, you have an access to fresh supply and demand zone as well as the historical supply demand zone. Hence, you can achieve much better profiling on price movement in Forex market. In addition, the trading zone idea provides you an excellent way of managing your trading risk. This is really useful if you have at least learnt how to use the support and resistance trading, which is the most popular technical analysis in Forex and Stock market. With Ace Supply Demand Zone, you can trade with the original supply demand zone trading. At the same time, you can also perform “Supply Demand Trading with Trendline”. Supply Demand Trading with Trendline is highly accurate ways to predict the turning point. You can have a look at the link below to find out everything about Supply Demand Trading with Trendline”.

https://algotrading-investment.com/2...ng-tutorial-1/

We recommend you to master this trading strategy with supply demand indicator for several reasons. Firstly, this trading strategy is not complex. Secondly, this trading strategy picks up the turning point very accurately. It is best to use Ace Supply Demand Zone to perform “Supply Demand Trading with Trendline”. However, there are many other ways to use Ace Supply Demand Zone to get good profits. For example, you can combine it with Harmonic Pattern or Elliott Wave Analysis. In addition, you can also use it together with turning point probability in Fractal Pattern Scanner. The detailed trading strategy can be found from the book: Technical Analysis in Forex and Stock Market: Supply Demand Analysis and Support Resistance.

With a lot of sophisticated functionality built inside, Ace Supply Demand Zone indicator will provide you unmatched performance against other Supply Demand zone indicator out there. Here is the link to Ace Supply Demand Zone Indicator.

https://www.mql5.com/en/market/product/40076
https://www.mql5.com/en/market/product/40075
https://algotrading-investment.com/p...y-demand-zone/

In addition, we provide the YouTube video for Ace Supply Demand Zone Indicator. In terms of indicator operation, both mean reversion supply demand and ace supply demand zone indicator are similar. Hence, you can watch this YouTube Video to accomplish the supply demand zone indicator.
YouTube “Supply Demand Zone Indicator”:
Inserted Video


Attached Image (click to enlarge)
Click to Enlarge

Name: Ace-Supply-Demand-Zone-Indicator-Released-for-MetaTrader.png
Size: 42 KB
 
 
  • Post #4,583
  • Quote
  • Aug 22, 2022 1:22pm Aug 22, 2022 1:22pm
  •  auto9817
  • | Commercial Member | Joined Aug 2008 | 9,352 Posts
Multiple Timeframe Scanning for Harmonic Pattern

Multiple Timeframe Scanning or multiple timeframe analysis is a convenient feature when you want to trade with Harmonic Pattern. It allows you to alert the latest harmonic pattern across all timeframe. It is handy that you can view all these patterns in one place. Here is simple screenshot showing you how to enable Multiple Timeframe Pattern Scanning in your Harmonic Pattern Plus and Harmonic Pattern Scenario Planner. Just enable Use Multiple Timeframe Pattern Detection = true in your input setting. That is all. Even if you attach one indicator per symbol only, you can still tell if any Harmonic Pattern is formed in another timeframe.
There is small “M” button in your chart in case you want to refresh multiple timeframe pattern scanning manually. If you are using MetaTrader 5 platform, then you might need this sometimes when data is not fully loaded in your MetaTrader. Especially, in MetaTrader 5 platform, it can take sometime to load data on lower and higher timeframe. However, once they are loaded, you should be able to see the patterns detected across all timeframe. In fact, this longer data loading is done because MetaTrader 5 platform is loading tick by tick data, which is really heavy for your CPU and Memory and this can not be controlled by the indicator. Hence, we can not blame the platform builder anyway as they tried to do something good intentionally in their end. Since in MetaTrader 4, they only load Open, High, Low and close price, the data loading time is pretty fast and not noticeable most of time. Please have a look at the YouTube video to understand the multiple timeframe analysis better with Harmonic Pattern.

Please watch YouTube video for full explanation:
Inserted Video


Link to Harmonic Pattern Plus
https://algotrading-investment.com/p...-pattern-plus/
https://www.mql5.com/en/market/product/4488
https://www.mql5.com/en/market/product/4475

Link to Harmonic Pattern Scenario Planner
https://algotrading-investment.com/p...nario-planner/
https://www.mql5.com/en/market/product/6101
https://www.mql5.com/en/market/product/6240

Attached Image (click to enlarge)
Click to Enlarge

Name: Harmonic-Pattern-Plus-Harmonic-Pattern-Scenario-Planner-Multiple-Timeframe-Pattern-Scanning-S001.png
Size: 53 KB
 
 
  • Post #4,584
  • Quote
  • Aug 23, 2022 11:32am Aug 23, 2022 11:32am
  •  auto9817
  • | Commercial Member | Joined Aug 2008 | 9,352 Posts
Fibonacci Chart Pattern

Fibonacci chart patterns are the chart patterns that structured with Fibonacci ratio. Fibonacci ratio is based on Fibonacci analysis. A Fibonacci analysis is a popular tool among technical traders. It is based on the Fibonacci sequence numbers identified by Leonardo Fibonacci in the 13th century. The Fibonacci sequence numbers are:
0, 1, 1, 2, 3, 5, 8, 13, 21, 34, 55, 89,144, 233, 377, 610, 987, 1597, 2584, 4181, 6765, …………………
As the Fibonacci number become large, the constant relationship is established between neighbouring numbers. For example, every time, when we divide the former number by latter: Fn-1/Fn, we will get nearly 0.618 ratio. Likewise, when we divide the latter number by former: Fn/Fn-1, we will get nearly 1.618. These two Fibonacci ratio 0.618 and 1.618 are considered as the Golden Ratio. We can use these Golden ratios to start our Fibonacci analysis. However, many technical traders use additional Fibonacci ratios derived from the Golden ratio. Since the calculation of each Fibonacci ratio is well known, I have listed all the available Fibonacci ratio calculation in Table 6.1.
In fact, Fibonacci pattern analysis in financial trading is extremely popular. As with support and resistance analysis, Fibonacci analysis is probably the most popular technical analysis among traders. There are two important techniques in Fibonacci analysis. First technique is Fibonacci retracement. Second technique is Fibonacci expansion. In fact, former is just one triangle pattern and latter is two triangle patterns. Hence, you can consider these two as Fibonacci price patterns. These two price patterns share the identical concept to the retracement ratio and expansion ratio.
There are two important points in regards to Fibonacci patterns. Firstly, you need to spot swing high and swing low in price series to identify Fibonacci price patterns. The easiest way of doing this is just to apply Peak Trough Transformation using either ZigZag indicator or Renko chart. Therefore, you start with predefined swing points in your chart. Secondly, Fibonacci retracement technique will concern one triangle that is two price swings. Fibonacci expansion technique will concern two triangles that are three price swings. Most importantly, calculation of Fibonacci retracement and expansion is identical to the retracement ratio and expansion ratio calculation in RECF notation. Sometimes, we might use percentage format instead of decimal format. However, two quantities are the same. For example, the Golden ratio 0.618 is the same as 61.8%.

You can continue to read full article here from the link below. This article will explains everything about "Fibonacc Chart Pattern". It is free but informative article.
https://algotrading-investment.com/2...rice-patterns/

You can also use Harmonic Pattern Plus in MetaTrader to detect Fibonacci Chart Patterns. Harmonic Pattern Plus is the advanced Fibonacci Analysis Indicator for your trading. Below are the Links to Harmonic Pattern Plus
https://www.mql5.com/en/market/product/4488
https://www.mql5.com/en/market/product/4475
https://algotrading-investment.com/p...-pattern-plus/

Attached Image (click to enlarge)
Click to Enlarge

Name: Figure-1-4_-Fibonacci-Retracement-drawn-over-daily-EURUSD-candlestick-chart-for-bearish-setup..png
Size: 12 KB
 
 
  • Post #4,585
  • Quote
  • Aug 24, 2022 5:22am Aug 24, 2022 5:22am
  •  auto9817
  • | Commercial Member | Joined Aug 2008 | 9,352 Posts
Stop Loss with Harmonic Pattern

Setting up the sensible stop loss can be tricky for harmonic patterns. Managing your stop loss and profit target is one of the most important aspect of Forex trading. This is a short simple article showing how to resize your stop loss and take profit with harmonic patterns. The main point is that the trading zone helps you to manage your stop loss and profit target for Forex trading. The same principle can be applied to the all the harmonic patterns including BAT, Gartley, Butterfly, Shark Pattern, Three drives, 5 to 0, etc.
https://algotrading-investment.com/2...nario-planner/

Likewise, managing stop loss and take profit target is so much easier with this automated Harmonic Pattern Scanner including Harmonic Pattern Plus and Harmonic Pattern Scenario Planner. Both Harmonic Pattern Plus and Harmonic Pattern Scenario Planner are available in MetaTrader 4 and MetaTrader 5.
Below is the landing page for Harmonic Pattern Plus with Japanese Candlestick Pattern Features.
https://algotrading-investment.com/p...-pattern-plus/
https://www.mql5.com/en/market/product/4488
https://www.mql5.com/en/market/product/4475

You can apply the same principle to Harmonic Pattern Scenario Planner.
https://www.mql5.com/en/market/product/6101
https://www.mql5.com/en/market/product/6240
https://algotrading-investment.com/p...nario-planner/


Attached Image (click to enlarge)
Click to Enlarge

Name: stop loss and take profit with harmonic pattern.png
Size: 41 KB
 
 
  • Post #4,586
  • Quote
  • Aug 25, 2022 1:56pm Aug 25, 2022 1:56pm
  •  auto9817
  • | Commercial Member | Joined Aug 2008 | 9,352 Posts
Advanced Supply Demand Zone Indicator

Here is the list of Advanced Supply Demand Zone Indicator. These supply and demand zone indicators are rich in features with many powerful features to help you to trade the right supply and demand zone to trading.

Mean Reversion Supply Demand

Mean Reversion Supply Demand indicator is our earliest supply demand zone indicator and loved by many trader all over the world. It is great to trade with reversal and breakout. You can also fully setup your trading with stop loss and take profit target.
Below are the links to the Mean Reversion Supply Demand indicator for MetaTrader 4/MetaTrader 5.
https://www.mql5.com/en/market/product/16823
https://www.mql5.com/en/market/product/16851
https://algotrading-investment.com/p...supply-demand/

Ace Supply Demand Zone

Ace Supply Demand Zone indicator is our next generation supply demand zone indicator. It was built in non repainting and non lagging algorithm. On top of many powerful features, you can also make use of archived supply and demand zone in your trading to find more accurate trading opportunity.
Below are the links to the Ace Supply Demand Zone indicator for MetaTrader 4/MetaTrader 5.

https://www.mql5.com/en/market/product/40076
https://www.mql5.com/en/market/product/40075
https://algotrading-investment.com/p...y-demand-zone/

For your information, both mean reversion supply demand and Ace supply demand zone indicator uses completely different algorithm in detecting supply and demand zone.


Attached Image (click to enlarge)
Click to Enlarge

Name: Ace-Supply-Demand-Zone-Indicator-Released-for-MetaTrader.png
Size: 42 KB
 
 
  • Post #4,587
  • Quote
  • Aug 26, 2022 11:34am Aug 26, 2022 11:34am
  •  auto9817
  • | Commercial Member | Joined Aug 2008 | 9,352 Posts
Price Breakout Pattern Scanner and Smart Renko

You can access the functionality of Smart Renko from Price Breakout Pattern Scanner too. You can also get the standalone smart renko indiactor too if you wish. There are two articles to explain the functionality of the Smart Renko. First article is short and second article is long. We recommend reading both articles to maximize the potential of the Price Breakout Pattern Scanner.
https://algotradinginvestment.wordpr...n-smart-renko/
https://algotrading-investment.com/2...ttern-scanner/

Our Price breakout pattern scanner is very unique tool in the market because it has the built in feature for Smart Renko inside. There is reason for that. Smart Renko is really helpful for the chart pattern detection in the separate sub window. So they can improve your trading decision made in the main chart. Imagine that in the main chart, Price Breakout Pattern Scanner is automatically detecting the patterns for you. In the indicator window, you can also detect any other important patterns readily. If you can collect evidence for your trading from both main chart and renko chart, you can make more accurate trading decision.

In this post, let us show how to switch on and off the smart Renko chart from your price breakout pattern Scanner. Before you are using Smart Renko feature enabled, you might download sufficient history in your chart first. Once you have done it, set Use “Smart Renko = true” from your indicator setting. See the screenshots for your better understanding. Some of our customer know that there is great way of trading with Price breakout pattern scanner and our Harmonic Pattern Plus (or Harmonic Pattern Scenario Planner) If you are curious, you migh check our ebook. We have described the trading principle in details in this book: Scientific Guide to Price Action and Pattern Trading.

Here are the links for the Price Breakout Pattern Scanner in MetaTrader 4 and MetaTrader 5. Both platform provide nearly identical features for Price Breakout Pattern Scanner. In addition, if you wish, you can also get the Smart Renko only as the sepearte indicator for your MetaTrader.
https://www.mql5.com/en/market/product/4859
https://www.mql5.com/en/market/product/4858
https://algotrading-investment.com/p...ttern-scanner/

Here are the links for Smart Renko indicator for MetaTrader 4 and MetaTrader 5 platform.
https://algotrading-investment.com/p...m/smart-renko/
https://www.mql5.com/en/market/product/9944
https://www.mql5.com/en/market/product/9911

Attached Image (click to enlarge)
Click to Enlarge

Name: Renko Chart.jpg
Size: 162 KB
 
 
  • Post #4,588
  • Quote
  • Aug 27, 2022 11:32am Aug 27, 2022 11:32am
  •  auto9817
  • | Commercial Member | Joined Aug 2008 | 9,352 Posts
Excessive Momentum

Excessive momentum referes to the too much momentum in Forex and Stock market. When unusually high momentum is observed in Forex and Stock chart, this often lead to two secnarios in financial market. Firstly, the momentum can be slow down and the market can change the direction. Secondly, the momentum can be slow down and the market can continue to its direction. First scenario is often used to trade the reversal pattern or reversal chart pattern. Second scenario is often used to trade the continuation pattern or continuation chart pattern. Regardless of which scenario we are dealing with, excessive momentum detection can help us to place accurate entry for our trading and investment. In fact, this idea is very similar to the Accumulation or Distribution area in the Volume Spread Analysis or Wyckoff Method. Hence, the disclipline of Volume Spread Analysis or Wyckoff Method can be used when you trade with Excessive momentum.

Excessive momentum is an important clue in our trading as well as the sideways market. You can consider Excessive momentum as the opposite concept to sideways market. So why Excessive momentum is important signal in our trading? Imagine that you are pouring some milk in your cup. It is fine until it is overflow. When milk is starting to get split from our cup, we realized that we need to take some correction.

This analogical concept can be applied to our trading too. Simply speaking, Excessive momentum can signal us that market can go through some brand new action from the existing trend. It might be turning point opportunity or reversal opportunity. Around this Excessive momentum area, market is more predictable. In addition, you have an opportunity to become early enterer with good profitable range.

Before, trader did not have a good tool to catch an excessive momentum but now we have the Excessive Momentum Indicator designed to catch Excessive momentum automatically in your chart. Good news is that this entry is more accurate with Excessive momentum than without Excessive momentum presents. Hence, Excessive momentum is ideal location to place your trading. Excessive momentum area is marked up as triangle in Excessive Momentum indicator.

At the same time, this Excessive Momentum Zone can be considered as either Accumulation or Distribution area in the Volume Spread Analysis. You can further find the symptoms of accumulation and distribution area using our Volume Spread Pattern Indicator (Paid and Advanced version) or Volume Spread Pattern Detector (Free and Light version). You can also watch the YouTube video to find out more about Excessive Momentum Indicator.

YouTube Video “Momentum Indicator”:
Inserted Video

======================================
Here is the landing page for Excessive Momentum Indicator available in MetaTrader 4 and MetaTrader 5.
https://www.mql5.com/en/market/product/30641
https://www.mql5.com/en/market/product/30621
https://algotrading-investment.com/p...tum-indicator/
Firstly, Volume Spread Pattern Indicator is the powerful volume spread analysis indicator that operated across multiple timeframe. Here is the link to Volume Spread Pattern Indicator.
https://www.mql5.com/en/market/product/32961
https://www.mql5.com/en/market/product/32960
https://algotrading-investment.com/p...ern-indicator/
Secondly, Volume Spread Pattern Detector is the light version of Volume Spread Pattern Indicator above. This is free tool with some limited features.
https://www.mql5.com/en/market/product/28438
https://www.mql5.com/en/market/product/28439
https://algotrading-investment.com/p...tern-detector/

Attached Image (click to enlarge)
Click to Enlarge

Name: Excessive-Momentum-Trading.png
Size: 23 KB
 
 
  • Post #4,589
  • Quote
  • Aug 29, 2022 3:50am Aug 29, 2022 3:50am
  •  auto9817
  • | Commercial Member | Joined Aug 2008 | 9,352 Posts
Winning Trading Logic – Detecting Supply and Demand Unbalance

As we have pointed out in our article, detecting the supply and demand unbalance is the most important key in making profits in Financial market. The excessive momentum indicator is the automated tool to detect these unbalance in supply and demand for your trading. With excessive momentum drawn in your chart, it is much easier to predict the timing of new trend and its direction.

Here is the insightful article explaining where the profits comes and how the profits are captured with the knowledge of excessive momentum. If you really want to make money in the market, must read this article. Reading does not cost you anything.
https://algotrading-investment.com/2...entum-trading/

This Excessive Momentum Zone can be considered as either Accumulation or Distribution area in the Volume Spread Analysis. You can further find the symptoms of accumulation and distribution area using our Volume Spread Pattern Indicator (Paid and Advanced version) or Volume Spread Pattern Detector (Free and Light version). You can watch the YouTube videos to find more about the Excessive Momentum Indicator.
YouTube Video Momentum Indicator:
Inserted Video


Here is link to Excessive Momentum Indicator available on MetaTrader 4 and MetaTrader 5 platform.
https://algotrading-investment.com/p...tum-indicator/
https://www.mql5.com/en/market/product/30641
https://www.mql5.com/en/market/product/30621

Attached Image (click to enlarge)
Click to Enlarge

Name: Excessive-Momentum-Indicator-with-Accumulation-and-Distribution-Area.png
Size: 32 KB
 
 
  • Post #4,590
  • Quote
  • Last Post: Aug 31, 2022 4:04am Aug 31, 2022 4:04am
  •  auto9817
  • | Commercial Member | Joined Aug 2008 | 9,352 Posts
Guide to Profitable Chart Patterns in Financial Market

Profitable Chart Patterns include Fibonacci Price Patterns, Harmonic Patterns, Elliott Wave, X3 Chart patterns as well as many other chart patterns. Some people might be curious how these profitable chart patterns are different from the technical indicator widely used like Bollinger Bands, MACD, RSI, Moving average, and so on. Let us put things simply like this. Technical indicators are based on applying some calculation or algorithm on the series of historical prices. Profitable chart patterns are those geometric shapes you can draw in your chart by connecting several price points. More precisely, several price points are higher highs and lower lows. They are also called peaks and troughs in cycle analysis. Using Profitable Chart Patterns are very similar to making use of our own intuition in scientific way.
Profitable chart patterns are the good buy and sell signal generator in financial market. It can provide you the early signal at the turning point. Unlike other technical indicator, you are not lagging with these profitable chart patterns. Hence you can always plan your trading ahead of other traders. In addition, it is easy to combine these profitable chart patterns with other analysis technique in your trading decision.

X3 Chart Pattern Scanner is one of the most powerful chart pattern recognition software in the market. This is non-repainting and non-lagging Harmonic Pattern Scanner. On top of the Harmonic Pattern detection, this tool can detect Elliott Wave, and X3 Chart Patterns. As a bonus, X3 Chart Pattern Scanner can detect around 52 Japanese candlestick patterns for your trading as well as advanced channel.

https://algotrading-investment.com/p...ttern-scanner/
https://www.mql5.com/en/market/product/41992
https://www.mql5.com/en/market/product/41993

In this book below, you can find the introduction for these profitable chart patterns. It is probably good to read this book before using these chart patterns although this is not compulsory.

Amazon: https://www.amazon.com/dp/B0B2KZH87K
Google Book: https://play.google.com/store/books/...d=7KrQDwAAQBAJ
Other links: https://algotrading-investment.com/p...-stock-market/

Attached Image (click to enlarge)
Click to Enlarge

Name: elliott-wave-12345-pattern-gbpusd-h1-timeframe-e1-2-1.png
Size: 15 KB
 
 
  • Commercial Content
  • /
  • Price Breakout Pattern Scalper EA For Free
  • Reply to Thread
    • 1 225226227228229 Page 230
    • 1 229 Page 230
2 traders viewing now
Top of Page
  • Facebook
  • Twitter
About FF
  • Mission
  • Products
  • User Guide
  • Media Kit
  • Blog
  • Contact
FF Products
  • Forums
  • Trades
  • Calendar
  • News
  • Market
  • Brokers
  • Trade Explorer
FF Website
  • Homepage
  • Search
  • Members
  • Report a Bug
Follow FF
  • Facebook
  • Twitter

FF Sister Sites:

  • Metals Mine
  • Energy EXCH
  • Crypto Craft

Forex Factory® is a brand of Fair Economy, Inc.

Terms of Service / ©2023