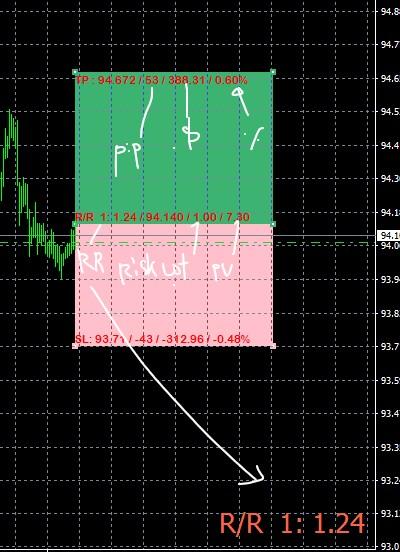
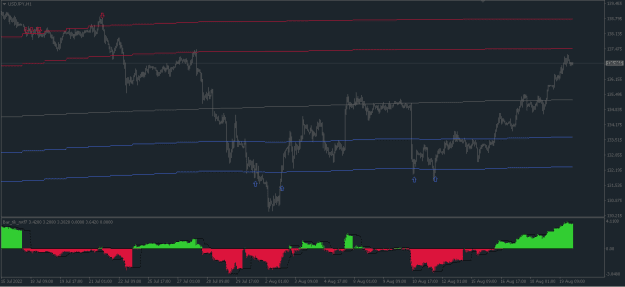
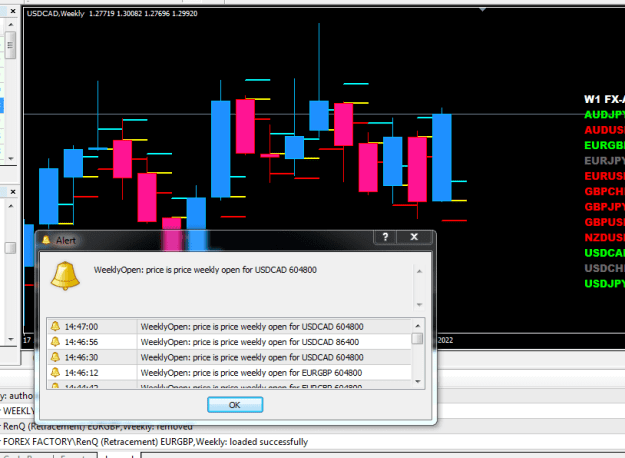
The easiest way to check if an indicator repaints, is to just run it in the tester:
Attached Image (click to enlarge)
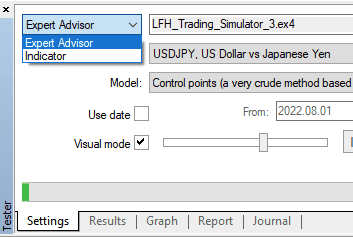
- normally I'd run a do nothing/random/practice ea in visual mode, so that I can load/unload the indicator by itself, and of course fast forward, and change settings while running, but if the indicator has timeseries functions, like itime/iopen etc then it'll work on loading, but wont run forward, so then the next point
- or run itself in indicator mode, it'll run normally but you wont be able to change settings without stopping and restarting
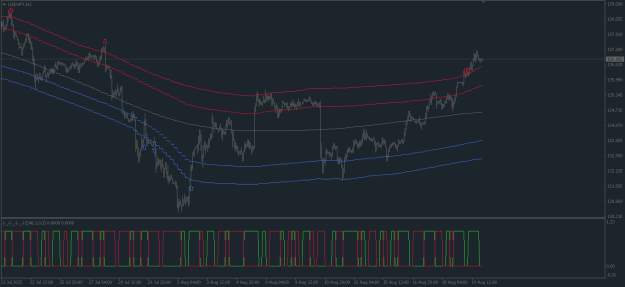
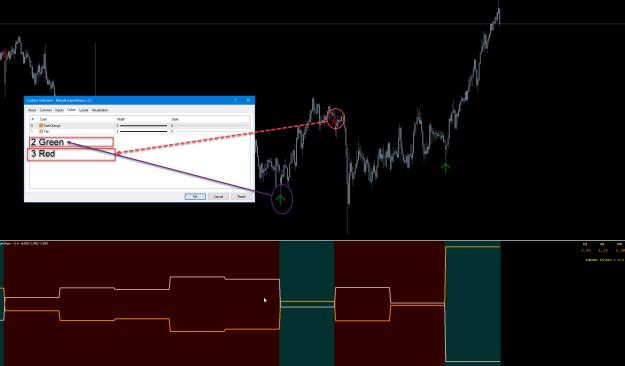
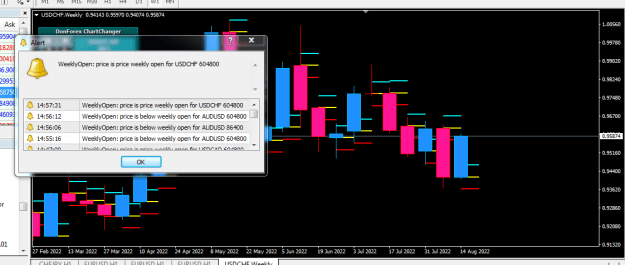
Example of what a large repainter looks like, many past indicator values are given new values:
gif
Attached Image (click to enlarge)
The not so easy way to check if an indicator repaints is to see if it's giving new values to past candles.
- usually drawing buffers are given values in OnCalculate, which is called on every new tick, on loading, or history update
- usually there will be 1 loop inside it where indicator values are determined. This loop will usually run over the whole chart history on loading, and then just the live candle on every new tick, ie past values are normally not changed
- the below lines show an example of this, the for loop runs as long as i(used to refer to a candle index) is above or equal to 0, from some starting value of i, all the way down to 0, decrementing i by 1 every time.
- On loading or history update, prev_calculated is equal to 0, so the value of limit is rates_total-1 (qty of bars on chart/size of time-ohlc-vol infomation), minus 1, for the last index(chart is indexed from 0 on the far right side)
- On every new tick, the value of prev_calculated is above 0, and usually equal to rates_total(the default return of OnCalculate), which makes the value of limit equal to 0, eg 100 bars on chart, on loading pc=0, limit=max(99-0,0), on new tick, pc=100, limit=max(99-100,0), so on new ticks the loop only runs over the live candle, ie no repainting old values
- sometimes the name of limit may be something else, or calculated in some other way, or the loop will run upwards from 0 instead of downwards from bars-1, whichever case, you can print out the value used before the loop runs to see what it is, or print out the i values from inside the loop after loading, to exactly what candles are being recalculated
Inserted Code
   int limit = MathMax(rates_total-1-prev_calculated,0);
   Print("pc=",prev_calculated","  limit=",limit);
   for(int i = limit; i >= 0; i--)
   {
         if(prev_calculated>0)Print("new tick, i=",i);
         buffer_ma[i] = iMA(...i);
} So what would a repainting indicator look like:
- on loading the indicator, everything is the same, but on every new tick, past candle values are re-calulated, not just the live candle, the limit value will be such that many candles are being looped over
- it may be written in many different ways, but printing out i values on new ticks will exactly show whats being re-calculated
- to make the above gif, the below was used, so on every new tick the candles 0-300 will be recalculated
Inserted Code
for(int i= 0; i<=nbars; i++)//nbars is user input of 300
{
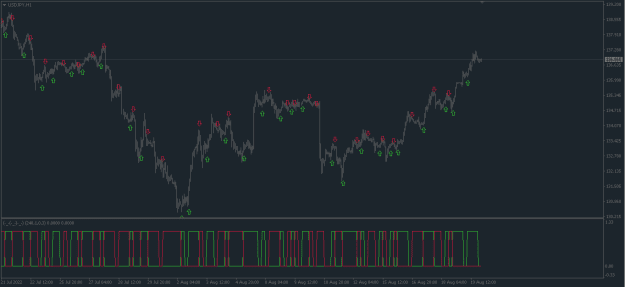
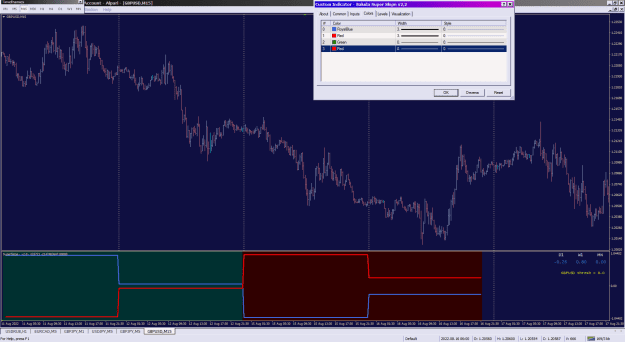
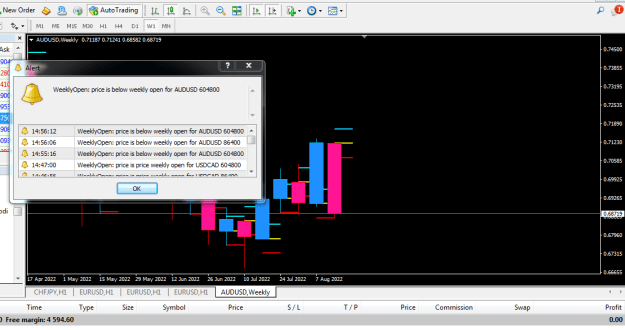
} - just limiting the loop to calc only the live bar, doesn't do much use, regarding this indicator, it requires past values to be used to recalculate a large period (a fisher transform), so just calculating the live bar itself creates a totally different indicator
gif
Attached Image (click to enlarge)
If using indicator values in an ea, and there are strange values obtained that lead to repainting suspicion-
- quickly check the indicators themselves aren't repainting
- print out the indicator value obtained and compare with the indicator loaded on with same settings, ie check youre getting the intended value of buffer number and candle index with intended settings
- if its not repainting, and you are getting correct values of the intended buffer and candle index and settings, then the issue is elsewhere
3