i closed eurgbp - 0.7% and still in eurusd daily and xauusd till now around +1.75% profit
Ignored
Ali, you are entering EURGBP on daily time frame.
Now the daily candle turned the opposite color but the daily candle just opened, need to wait until it closes to determine whether or not you should exit, right?
So, what was your judgement to exit the trade?
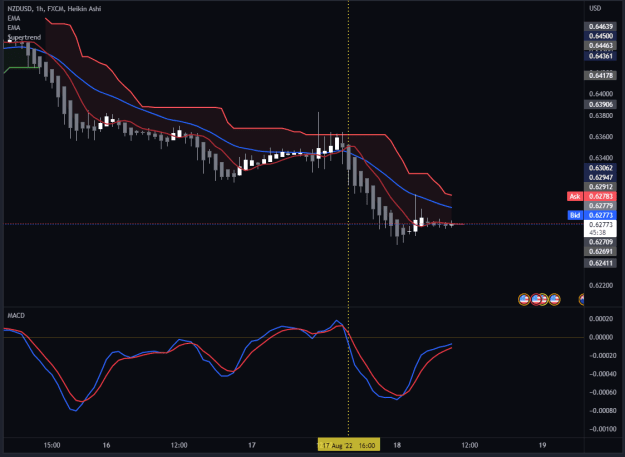
Missed these two trades from yesterday.
(edit: the yellow vertical line is the signal/setup candle)
NZDUSD
I was in front of the screen but somehow did not see this.. Might be because I was distracted by work?
Attached Image (click to enlarge)
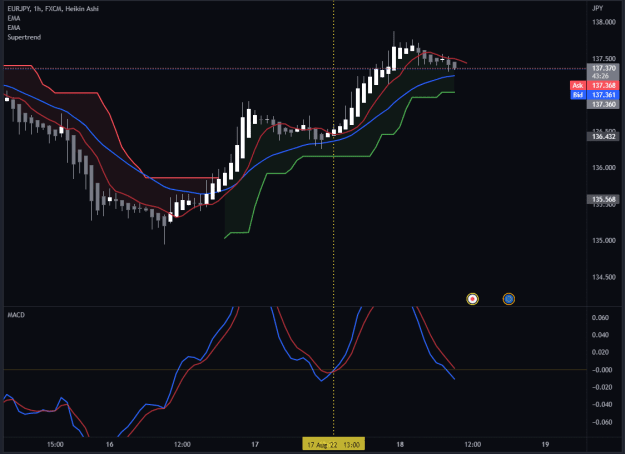
EURJPY
Saw this but since the candle were small, I did not take this.
Turned out it would have become a nice win If I took it.
Attached Image (click to enlarge)
Cutting down my watchlist now so I can concentrate better, because normally you WILL get signal during London open, so might as well focus on few good pairs that normally moves fast during London open.
{quote} Hi man, I think I understand the way you think. Let's say your 1% is 25 USD; if entering on 4H makes you having to wait four times longer (compared to 1H entry) only to get the same 25 USD, while at the same time you could have made 4 winning trades on 1H, might as well quadruple the volume on 4H, right? Haha. It's just a matter of preference. Ali emphasizes entering on higher time frames because according to him, it's better for your psychology/mental/mind, and less noise.
Ignored
The essence of trading is profit/loss and time. I recommend the time of one tax period for evaluation. It is not the best idea to have only one trade with expected profit in % per year.
Please excuse the bad English via Google Translate.
{quote} Ali, you are entering EURGBP on daily time frame. Now the daily candle turned the opposite color but the daily candle just opened, need to wait until it closes to determine whether or not you should exit, right? So, what was your judgement to exit the trade?
Ignored
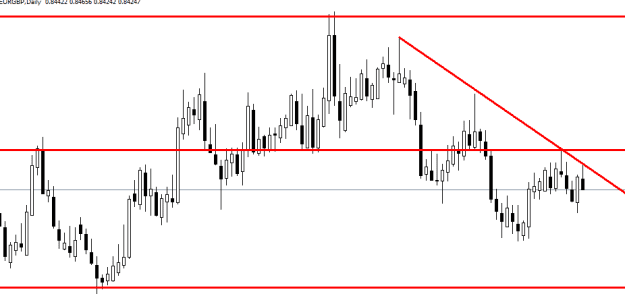
i get out because engulfing candle but it was better to wait until candle color change
Attached Image (click to enlarge)
Cut your losses. Cut your losses. Then maybe you have a chance
{quote} i get out because engulfing candle but it was better to wait until candle color change {image}
Ignored
I see. So you're also paying attention to the normal candlestick. That makes us the same actually haha.
I actually have two layouts on my Tradingview. A small window on the right containing a normal candlestick chart, but cropping it every time I upload here.
|
Joined Jun 2010
|
Status: Trader
|441 Posts|
Online Now
Closed trade early before price closed above 5 ema, 90 pips gained. Bedtime here in eastern U.S., so won't be aware if price reverses, which it often does during the night hours.
Attached Image (click to enlarge)
"Be the change that you wish to see in the world." --Gandhi
Want to share this for everyone.
I trade the 1H and this is my favorite setup.
First you want to go to the daily time frame.
Find your usual setup as if you were going to enter the trade on daily candle.
We know this system is based on momentum, and if one signal/setup candle appears, this means usually the next candle will continue the movement.
Then you want to go down to 1H time frame after that daily signal candle closes.
Then guess what? Yes you're right. Just find the same signal candle to the daily direction.
Depending on the pairs, usually the 1H signal appears around London session.
TL;DR, this is the usual 1H entry, but has a really strong confluence in the form of daily signal candle.
Here are two examples. I can literally find tens or hundreds of examples (both played out and did not play out) but for the sake of this post, I'll just post two.
Time shown below are GMT+9.
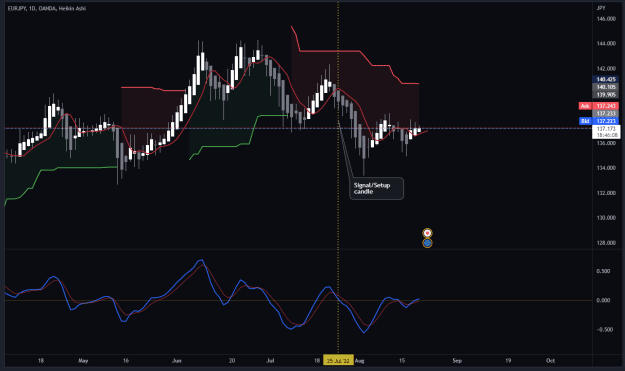
EURJPY
1. Daily time frame. We see that signal/setup candle appears on July 25 (vertical dotted yellow line) ⇒ this means on July 26, price is expected to go down, right?
Attached Image (click to enlarge)
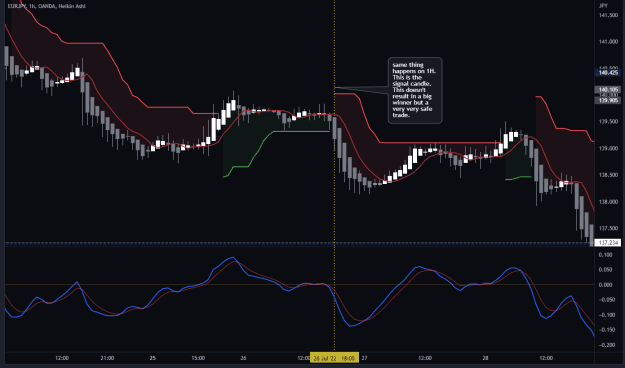
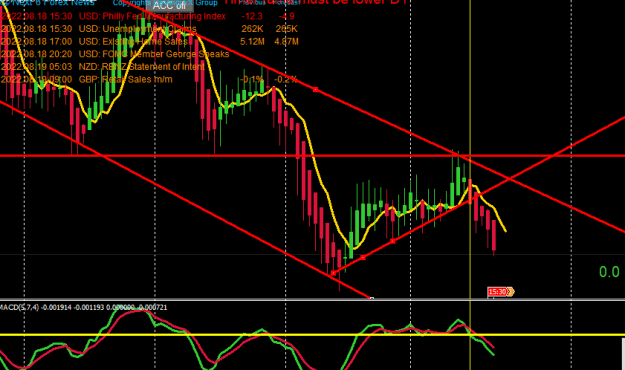
2. On to the 1H time frame. On July 26 just right before London open, we again find a bearish signal candle (vertical dotted yellow line).
Now, Donchian Trend - MACD - price action both giving you bearish signals (that's SIX confluences already).
I don't know what's wrong with you if you don't take this trade.
Attached Image (click to enlarge)
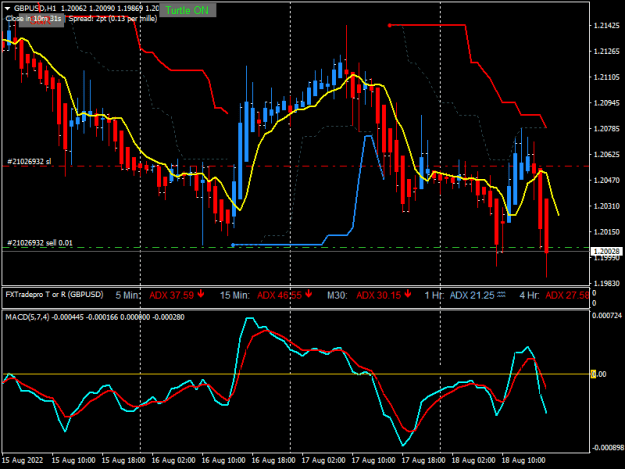
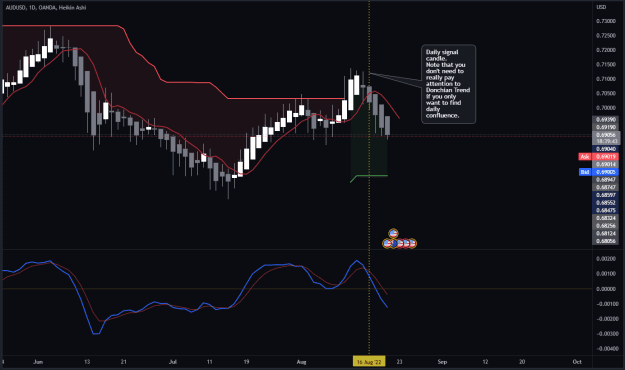
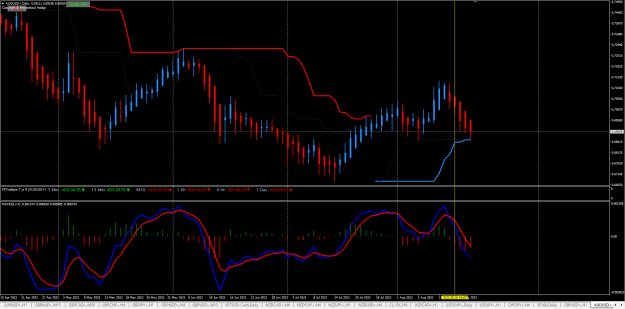
AUDUSD
August 16 - daily TF signal
Attached Image (click to enlarge)
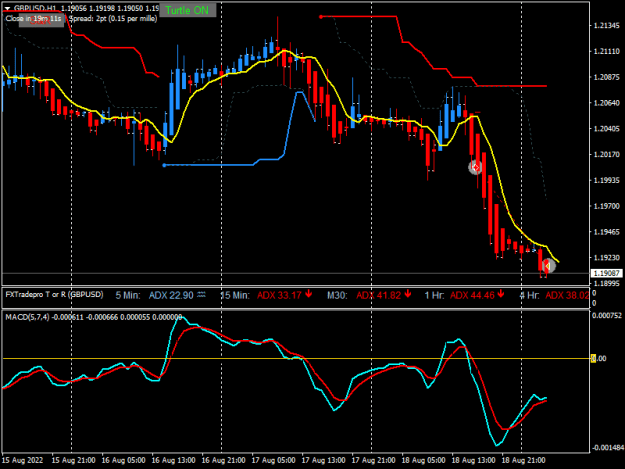
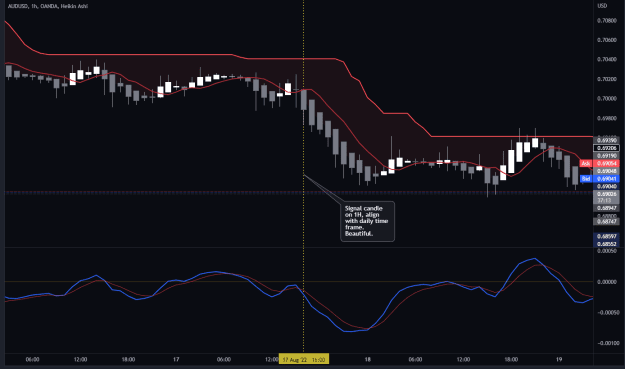
August 17 - 1H execution
Attached Image (click to enlarge)
But as we all know, not every scenario will play out!
So be wise with your risk management.
Try backtesting it this weekend, it'll up your game next week.
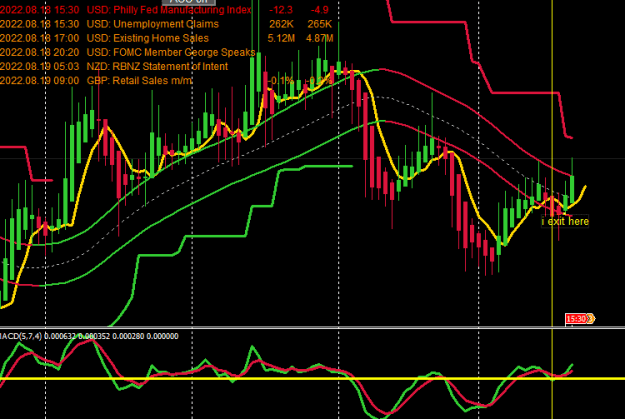
i took this week 5 trades (1 LOSSER+2 WINERES+2 STILL OPEN WITH GOOD PROGIT) 1 losser -0.75% EURGBP daily{image}2 trades closed IN PROFIT EYRJPY +2.7% GBPJPY+1.8%{image}{image} AND 2 TRADES STILL OPEN AND ARE IN GOOD PROFIT XAUUSD EURUSD{image}{image}
Ignored
Hello Ali, what is your overall profit this week , in percentage ?
{quote} Hi JP, really loving your posts and inputs, keep it up - really interesting! You and Ali are nailing it here, thanks so much!
Ignored
Thank you very much as well, man. Glad I could help.
I'm still in a journey to find the best utilization of this system myself.
But forex trading is a world where the more you share your knowledge, the better it is for you and everyone.
Have a nice weekend, man.
i took this week 5 trades (1 LOSSER+2 WINERES+2 STILL OPEN WITH GOOD PROGIT) 1 losser -0.75% EURGBP daily{image}2 trades closed IN PROFIT EYRJPY +2.7% GBPJPY+1.8%{image}{image} AND 2 TRADES STILL OPEN AND ARE IN GOOD PROFIT XAUUSD EURUSD{image}{image}
Ignored
Hey man on what time frame you took the EJ and GJ?
Want to share this for everyone. I trade the 1H and this is my favorite setup. First you want to go to the daily time frame. Find your usual setup as if you were going to enter the trade on daily candle. We know this system is based on momentum, and if one signal/setup candle appears, this means usually the next candle will continue the movement. Then you want to go down to 1H time frame after that daily signal candle closes. Then guess what? Yes you're right. Just find the same signal candle to the daily direction. Depending on the pairs, usually...
Ignored
Hi, I don't want to challenge your competences, because you are doing a very good job here, but the example on the AUDUSD currency pair from the D1 interval on August 16 is not a good sell signal in my opinion and from what I understand this strategy. In this example, the price is above the blue TURTLE line, not the red below it, and then this example would be a good one. Nevertheless, I do not see any sell signals here, and then on the H1 interval you talk about the sell signal in accordance with the D1 interval, on D1 there is no signal, unless I misunderstood the rules of this system. I am asking for a hint from the author of the post to resolve Alihelmy123 doubts, if you could see this example, I would be grateful. And do not treat my words as criticism, but a lesson to learn about this system
I would just like to thank Ali and JPN for their posts. Philosophically this method really resonates with me, and I have had a good 2 weeks in the market, thanks to you guys.
Ali, can you just please clarify the reason for the moving average channel in the revised model.
Once again Thank you.
{quote} Hi, I don't want to challenge your competences, because you are doing a very good job here, but the example on the AUDUSD currency pair from the D1 interval on August 16 is not a good sell signal in my opinion and from what I understand this strategy. In this example, the price is above the blue TURTLE line, not the red below it, and then this example would be a good one. Nevertheless, I do not see any sell signals here, and then on the H1 interval you talk about the sell signal in accordance with the D1 interval, on D1 there is no signal,...
Ignored
Hi Nolan, noo I don't feel challenged at all, if I'm wrong then I'm wrong, haha.
Also I respect you for pointing this out politely . You had the choice of calling me names or using unpleasant words just like we like to see in other threads.
Okay so the discussion is about this:
D1 - bullish. Turtle/Donchian Trend is showing bullish color (green on my platfrom, blue on yours)
H1 - bearish.
With this, the MACD crossing down on the daily should not be counted as signal.
Right?
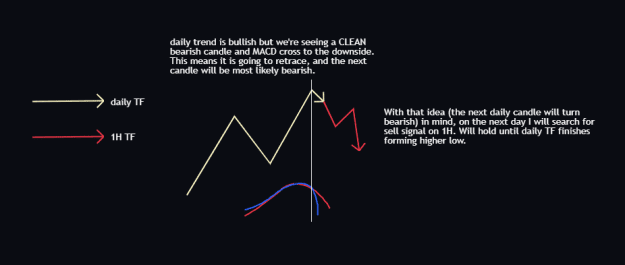
The idea of this trade is:
D1 is bullish, but then there is a MACD cross to the downside.
This means, D1 is pulling back (retracing) to form a higher low.
If so, then we will see H1 forming a bearish movement.
In other words, I am taking a daily counter trend move.
That's why on my note on that screenshot, I wrote something like "we don't have to pay too much attention on the Turtle Trend direction on the daily".
That is because I just want to find the daily momentum to confirm that the next daily candle will turn bearish as well.
If I am sure that the next daily candle will turn bearish (because of that MACD cross momentum), that means the next day, I have 24 pieces of H1 candles to take a short position from.
Am I making myself clear? Tried my best to explain in as simple as possible.
Take a look at the drawing below to see visually what I was saying.
Attached Image (click to enlarge)
Have a nice weekend, Nolan!
---
Edit:
On second thought, I probably should have not posted about this counter trend idea. It's a bit advanced for people who just started learning the system. You will need to have the understanding of how multi time frame works first.
Nolan thanks for your input!
{quote} Hi, I don't want to challenge your competences, because you are doing a very good job here, but the example on the AUDUSD currency pair from the D1 interval on August 16 is not a good sell signal in my opinion and from what I understand this strategy. In this example, the price is above the blue TURTLE line, not the red below it, and then this example would be a good one. Nevertheless, I do not see any sell signals here, and then on the H1 interval you talk about the sell signal in accordance with the D1 interval, on D1 there is no signal,...
Ignored
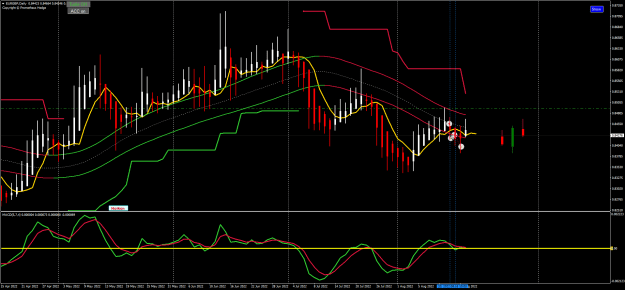
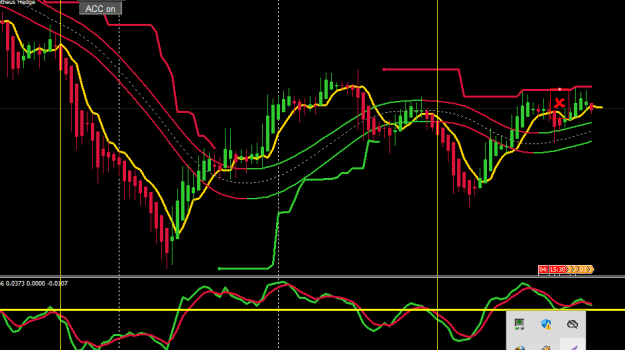
GOOD QUESTION
BRO I MENTIONED IN POST 216 https://www.forexfactory.com/thread/...3#post14101493
THAT EXPERIENCED TRADERS THAT CAN DETERMINE MARKET CONDITIONS (SUPPORT -RESISRANCE- TRENDLINE -MARKET TREND OR SIDEWAY) CAN TAKE TRADES WITH MACD CROSS LINE WITH OR WITHOUT DIRECTION OF TURTLE TREND IN LONG TIME FRAMES ONLY
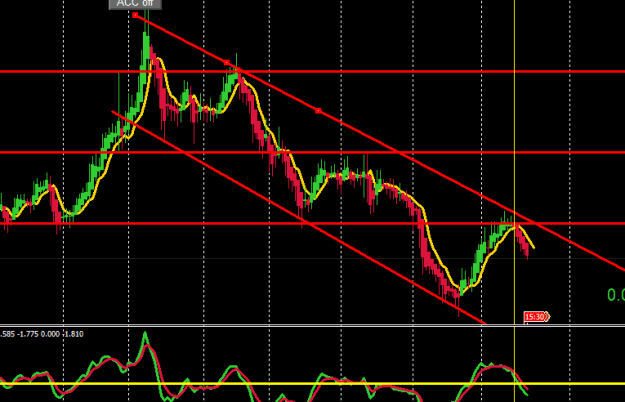
EXAMPLE
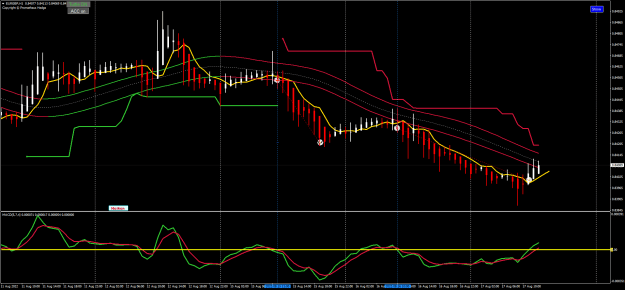
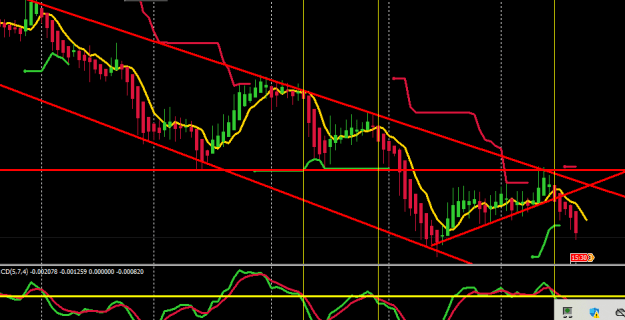
I TAKE A EURUSD TRADE IN DAILY CHART AGAINST TURTLE TREND BECAUSE I FOUND RETURN FROM WEEKLY RESISTANCE AND DAILY TREND AND MACD BLUE LINE CROSE RED AND ZERO LEVEL
Attached Image (click to enlarge)
BUT I DONT RECOMMENDED TRADING AGAINST TURTLE TREND IN LOW TIME FRAMES AND ESPECIALLY FOR NEW TRADERS
I HOPE I CLARIFY
ANY EXPERIENCED TRADER CAN TAKE ALL MACD CROSE LINES WITH OR WITHOUT TURTLE TREND AFTER DETERMINE MARKET CONDITIONS
Cut your losses. Cut your losses. Then maybe you have a chance
I would just like to thank Ali and JPN for their posts. Philosophically this method really resonates with me, and I have had a good 2 weeks in the market, thanks to you guys. Ali, can you just please clarify the reason for the moving average channel in the revised model. Once again Thank you.
Ignored
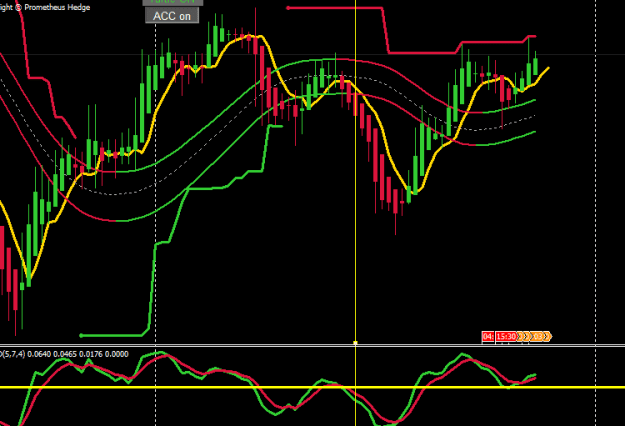
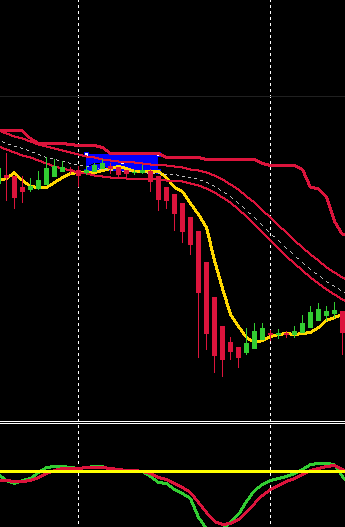
GOOD QUESTION
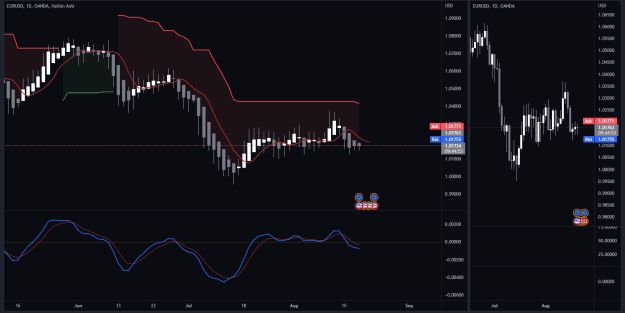
I PUT IT TO BE MORE OBSERVATION FOR NEW TRADERS SOMETIMES IN SIDE WAY MARKETS AND LOW MOMENTUM YOU FOUND THAT CANDLES MOVE INSIDE THE CHANNEL SO IT WILL BE MORE OBSERVE THAT APB CANDLES ARE SMALL AND BETTER WAIT FOR CANDLE TO BROKEN CHANNEL AND MACD BROKEN ZERO LEVEL
LIKE IN THIS CASE
Attached Image
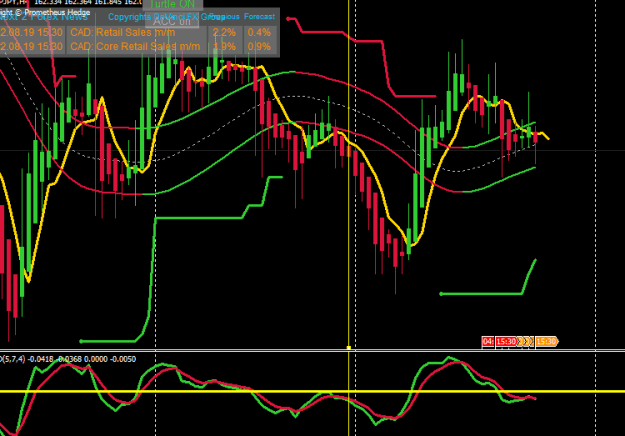
AND IN SAME CASES IT BETTER FOR NEW TRADERS NOT TAKE TRADES AGAINST AVERAGE CHANNEL LIKE IN THIS EXAMPLE AND BETTER TO WAIT FOR MACD BROKEN ZERO LEVEL AND CANDLE BROKEN THE CHANNEL
Attached Image (click to enlarge)
IT IS NO MORE FILTERATION FOR NEW TRADERS IF YOU CAN DETERMINE MARKET CONDITIONS YOU CAN TRADE WITH MACD AND APB CANDLES ONLY IN LONG TIMEFRAMES
Cut your losses. Cut your losses. Then maybe you have a chance