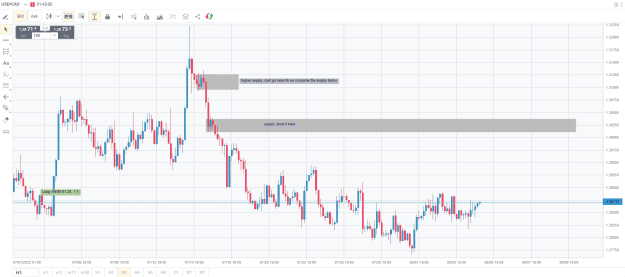
USDCAD is clear, but EURGBP in a little less clear on lower time frame. the lower level is somewhat tested already and it happens in the middle of the move which is ok somtimes, but the higher level is a fresh level and ill be for sure shorting it by. ill see how it approaches the two levels.
cad news is coming out tmrw, should give the pair a budge, again as long as we stay above demand on lower time frame.
Ignored
will prob get some whip action towards this level tomrw, for the news for cad. so keep an eye out for that level. you could prob short it here, then long it by a demand for a continuation of the move up. but hey what do i know.
{quote} USDCAD is clear, but EURGBP in a little less clear on lower time frame. the lower level is somewhat tested already and it happens in the middle of the move which is ok somtimes, but the higher level is a fresh level and ill be for sure shorting it by. ill see how it approaches the two levels. {image}
Ignored
Thank you, Joe. so much learning from you. Have a great day!
Hi Joe, in EURGBP you mentioned the confirmation candle. Could you please explain to me what confirmation candles are? I would appreciate it if you post any example charts. Thank you!
{quote} Hi Joe, in EURGBP you mentioned the confirmation candle. Could you please explain to me what confirmation candles are? I would appreciate it if you post any example charts. Thank you!
Ignored
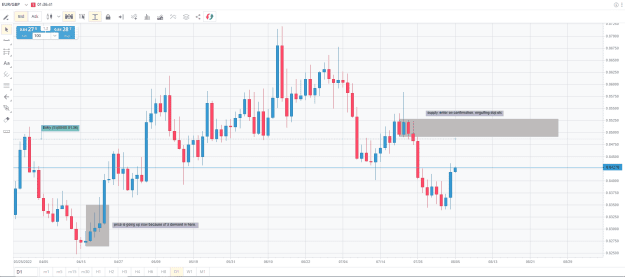
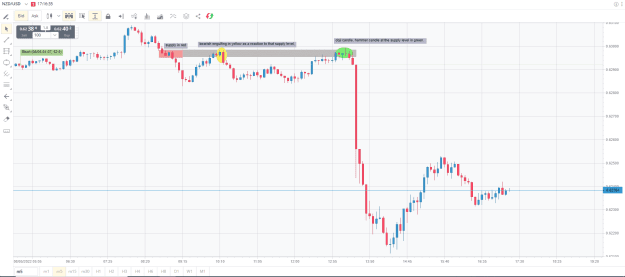
yeah sure, this is just an example of one chart which happens to be now in NZDUSD.
you have your supply level in red, in red is a flag in price, its a drop base drop, its that small blue candle next to all the red candles going down. that blue candle is what you consider shorting. now as price returns to that level, it creates an engulfing candle to the down side, that's your entry to get in to a short. same thing when price enters it a second time this time creates a hammer candle and doji candle at that supply level. thats it really.
so when price comes close to that supply level on EURGBP daily chart, you want to have a reversal candle in that same place of the supply, thats your 'indication' to get in short, or confirmation.
{quote} yeah sure, this is just an example of one chart which happens to be now in NZDUSD. you have your supply level in red, in red is a flag in price, its a drop base drop, its that small blue candle next to all the red candles going down. that blue candle is what you consider shorting. now as price returns to that level, it creates an engulfing candle to the down side, that's your entry to get in to a short. same thing when price enters it a second time this time creates a hammer candle and doji candle at that supply level. thats it really. so...
Ignored
Thank you Joe! I got the first part that you can enter short trade once we see engulfing candle reversal pattern in the SZ.
I didn't get the second part. The second time when the price came into that zone it had broken the Supply Zone. So how one can consider to re-enter in that zone when the original SZ had already broken?
{quote} Thank you Joe! I got the first part that you can enter short trade once we see engulfing candle reversal pattern in the SZ. I didn't get the second part. The second time when the price came into that zone it had broken the Supply Zone. So how one can consider to re-enter in that zone when the original SZ had already broken? Thank you
Ignored
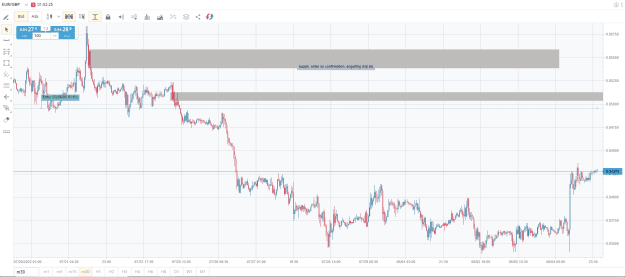
I hope we are looking at the same chart, but price did not break that supply zone. it stayed below it. it spiked above it for a few min but then closed at it or below with a doji candle. that was a confirmation to go short a second time.
{quote} Thank you Joe! I got the first part that you can enter short trade once we see engulfing candle reversal pattern in the SZ. I didn't get the second part. The second time when the price came into that zone it had broken the Supply Zone. So how one can consider to re-enter in that zone when the original SZ had already broken? Thank you
Ignored
price didnt close above it, and in my view that supply is definitely still intact.
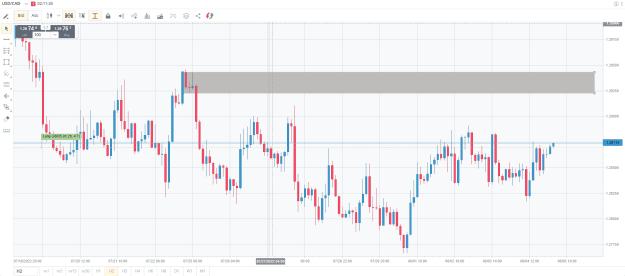
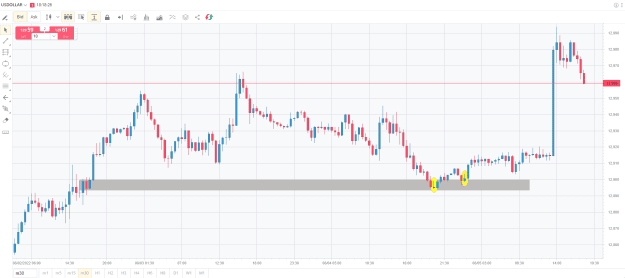
this is USD busket. if you look at the 2h chart there was a rallly base rally on that time frame, so you go into a lower time frame, pick the demand higher up and trade it from there.
those yellow little candles is the confirmation to enter long, and thats clearly where price went up from. that confirmation are both inverted hammers as a signal to enter long.
{quote} price didnt close above it, and in my view that supply is definitely still intact.
Ignored
yes, we are looking at the same chart, Joe! Okay, so I didn't know if the price closes in the sz zone even though the high of the candle goes outside the SL line it's still intact. This is something new I learned today from you. Thank you. I studied at Online Trading Academy I remember there once a senior trader told me about this but I didn't pay attention to it because it was not in the syllabus so now I remember It. Sorry, another question. So in this second scenario where you will keep your stop-loss line?
another example then im off for the day. this is USD busket. if you look at the 2h chart there was a rallly base rally on that time frame, so you go into a lower time frame, pick the demand higher up and trade it from there. those yellow little candles is the confirmation to enter long, and thats clearly where price went up from. that confirmation are both inverted hammers as a signal to enter long. {image}
Ignored
Excellent example! I understand it now! Thank you, Joe, this was a good discussion. I enjoyed it.
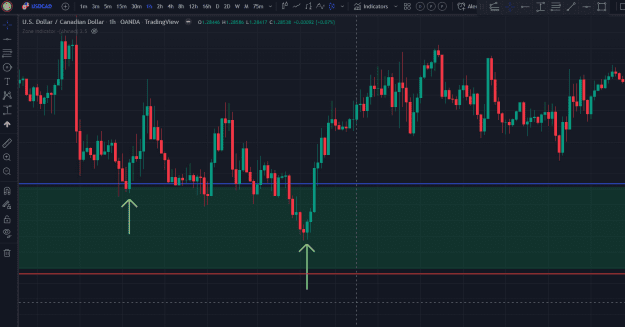
{quote} theres also this demand that price needs do consume {image}
Ignored
Hi Joe,
I was backtesting this 'confirmation trade' style. so I came across this example. You had shared this 4hr DZ of USDCAD which did work. So I went to look into smaller time frame of 1hr to see if there is any confirmation sign.
So I saw two engulfing patterns and I marked it.. could you please see if am doing it correctly?
{quote} another question. So in this second scenario where you will keep your stop-loss line?
Ignored
Which scenario are you referring too?
With my method, Normally if you find the correct levels, your stops should be either below or on top of a flag or cap in price. Normally quite tight. If you want to play it safe you would put it above or below the most recent high or low.
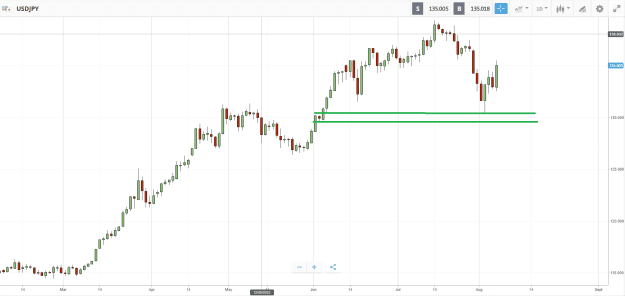
{quote} I dont like commenting on pairs i dont trade, but if we looking at the same chart which is USDJPY, on this one chart that you have shown, the up trend is still intact as long as we are above this demand on the daily. its also the most likley place that price is going to.{image}
Ignored
did anyone take this trade? I didnt take this one. but working out well for those who did.
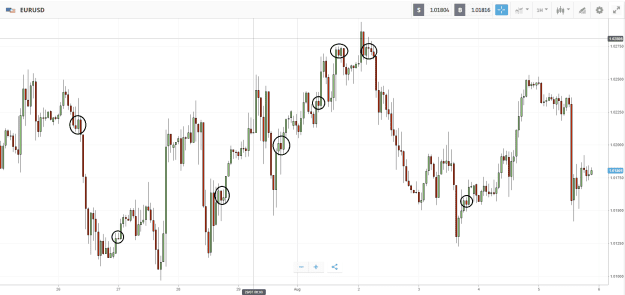
{quote} Hi Joe, I was backtesting this 'confirmation trade' style. so I came across this example. You had shared this 4hr DZ of USDCAD which did work. So I went to look into smaller time frame of 1hr to see if there is any confirmation sign. So I saw two engulfing patterns and I marked it.. could you please see if am doing it correctly? {image}
Ignored
yes you can look on lower time frames and can confirm it with reversal candles. there was also bullish engulfing and a doji candle on the 4h chart.
the idea is to pretty much find reversal candles on different time frames. you dont really need to go into lower time frames if you have a reversal candle on the same time frame you looking at with the S&D.
you go into lower time frames when looking for supply and demand levels.
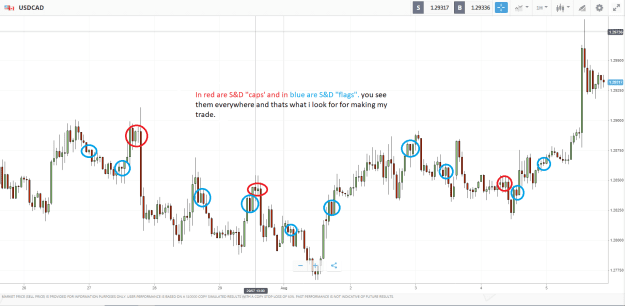
when i am referring to supply and demand levels i'm referring to S&D ''caps and flags''. you see them everywhere. its what i look for making a decision to enter long or short.
confirmation is another thing where price reacts to that cap or flag in price, and we look for reversal candles at those flags and caps.
between the two i just explained above, you need to look on different time frames which puts it all together.
just to note my method is different to akt method, we look for two different things to enter a trade. I dont know his mmethod and never looked into how his method works, nor do i need to as my method works for me. i know what to look for.