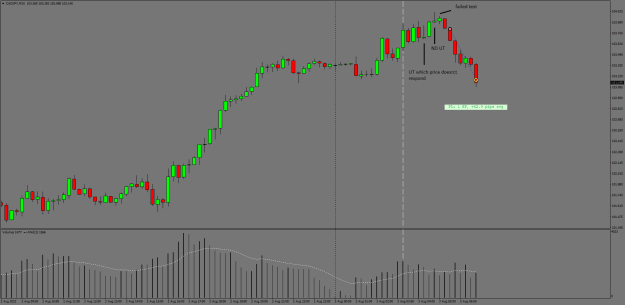
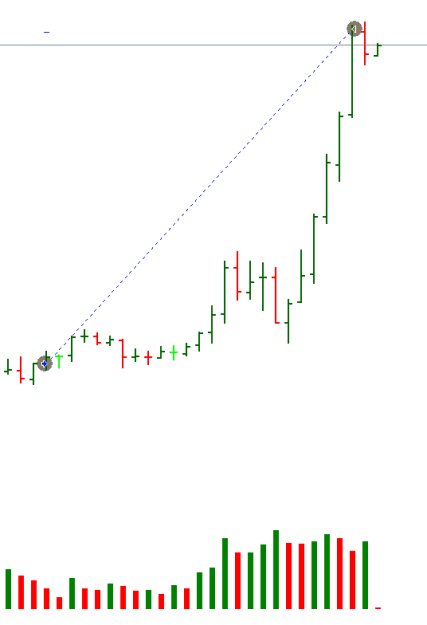
Appreciate you sharing the trade. Can you elaborate on your entry? I see it's a successful trade but I don't quite understand the rationale behind the entry unless the chart you shared is not the chart you used for your entry? I see some absorption in the bar prior to your entry but I don't see any low volume/testing (which AFAIK is the typical/ideal VSA pre-entry price action)
- #35,742
- Jul 25, 2022 6:05am Jul 25, 2022 6:05am
- Joined Aug 2009 | Status: Reading the TAPE | 2,389 Posts
Without VSA, you're playing checkers while the Smart Money plays chess.

- #35,745
- Jul 26, 2022 4:53am Jul 26, 2022 4:53am
- Joined Aug 2009 | Status: Reading the TAPE | 2,389 Posts
Without VSA, you're playing checkers while the Smart Money plays chess.
- #35,748
- Jul 26, 2022 5:52pm Jul 26, 2022 5:52pm
- Joined Aug 2009 | Status: Reading the TAPE | 2,389 Posts
Without VSA, you're playing checkers while the Smart Money plays chess.
- #35,749
- Edited 9:15pm Jul 26, 2022 8:18pm | Edited 9:15pm
- Joined Jan 2015 | Status: Trader | 1,461 Posts

- #35,753
- Aug 2, 2022 6:54pm Aug 2, 2022 6:54pm
- Joined Sep 2015 | Status: Trader | 2,516 Posts
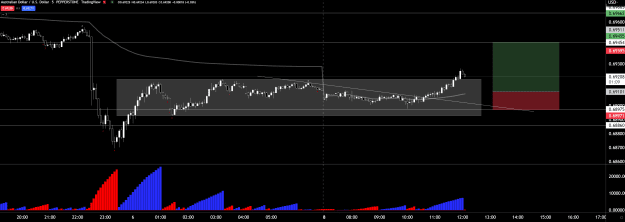
Trading thin liquidity at the boundary of the charts