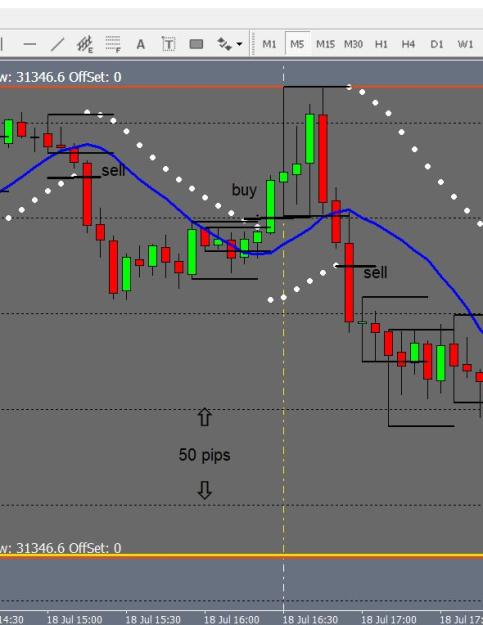
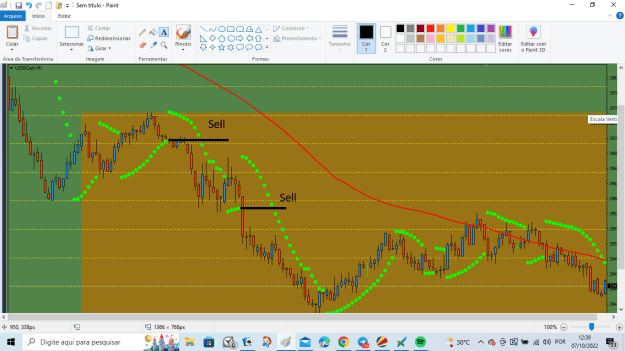
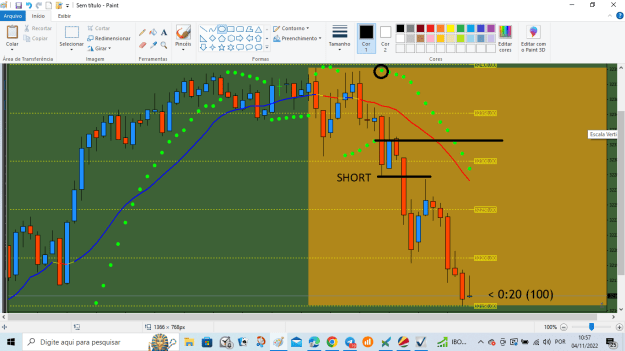
M.MOE you are right about the sell, my entry is not consistent with the criteria...I took it because I also use some price action structures. on the photo you can easily see an inside bar and when breaking, the psar rocking market, and under the MVA. When the market breaks such a structure imverses the PSAR and below mva then I take the position
now if you calculate the magnitude of the inside bar structure (between the high and the low) you get about 25 pips....that's your risk. the market when it breaks 2 structures (IB and PSAR) does not stop easily so you can easily take around 25 pips (the structure size of IB) that's why I took it.... I hope that it's clearer. look at the attached photo
same think for the next position, broken IB , revers PSAR and under MVA environ80 pips... the first one around 50-60 pips day done...
sorry I forget the buy another 50-70 pip
Joined Oct 2009
|
Status: Jack of All Trades
|830 Posts
jul3s, thank you for posting the method.
There is one thing I'd like to doublecheck:
"2. Once a BUY signal appears, draw a line on the last Sell dot SAR indicator created." Is is a horizontal line that we should draw - like on Liberty's chart in post #22?
Thanks again.
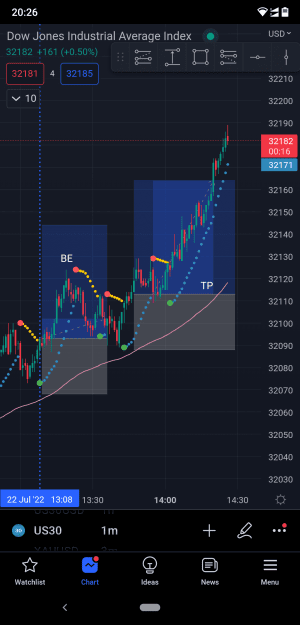
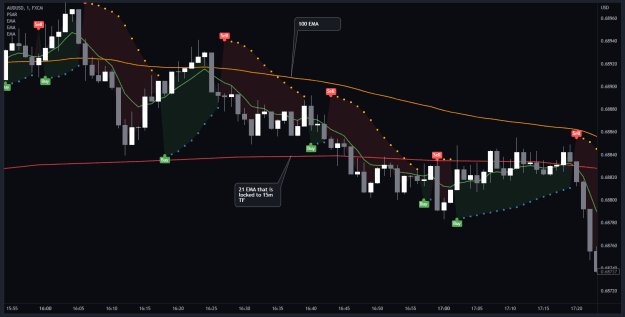
Tested this quite a few times and I think this is good.
Not so good to trade on the higher time frames, especially with this August volumes, but on 1m it's good.
I tried to improved it by adding one more EMA that is locked to the 15m TF.
Attached Image (click to enlarge)
The idea is:
If price is above both 100 EMA and 15m's 21 EMA, it's a strong buy. Vice versa with the sell.
If price is WITHIN the two EMAs, though.. That's a red flag where you should not be trading. Pretty useful during my backtest.
Also during my short testing, on 1m on AUDJPY pair (I randomly selected a pair that is volatile during Asia open), 10 pips SL with 20 pips TP seemed to work the best.
That's my two cents. I think depending on the pairs, the SL-TP size should be customized because of each pair's characteristic.
{quote} Great spreadsheet! Thanks for sharing with us. You've inspired me. Only thing is: US30 won't move too much during Asian session and spread will be large. Try HK50 instead during Asian session?
Ignored
hello please any link to get this templates thanks
Tested this quite a few times and I think this is good. Not so good to trade on the higher time frames, especially with this August volumes, but on 1m it's good. I tried to improved it by adding one more EMA that is locked to the 15m TF. {image} The idea is: If price is above both 100 EMA and 15m's 21 EMA, it's a strong buy. Vice versa with the sell. If price is WITHIN the two EMAs, though.. That's a red flag where you should not be trading. Pretty useful during my backtest. Also during my short testing, on 1m on AUDJPY pair (I randomly selected...
Ignored
hello
You can trade a chart however you want.
the reality is always different, the trade depends on the volume.
flashpaul, if I'm not mistaken 2nd SELL is on a candle close as PSAR signal is formed on the candle close and not before. Besides that, 2nd SELL is a win anyway as per the rules by OP. Thanks for bringing this thread to my attention regardless
flashpaul, se non sbaglio 2nd SELL è su una candela chiusa poiché il segnale PSAR si forma sulla candela chiusa e non prima. Oltre a ciò, la 2a VENDITA è comunque una vittoria secondo le regole di OP. Grazie per aver portato questo thread alla mia attenzione a prescindere
I will definitely be backtesting this strategy, it seems very very interesting.
Just a quick question, does it only work for US30 or is there any other index?