Attached Image (click to enlarge)

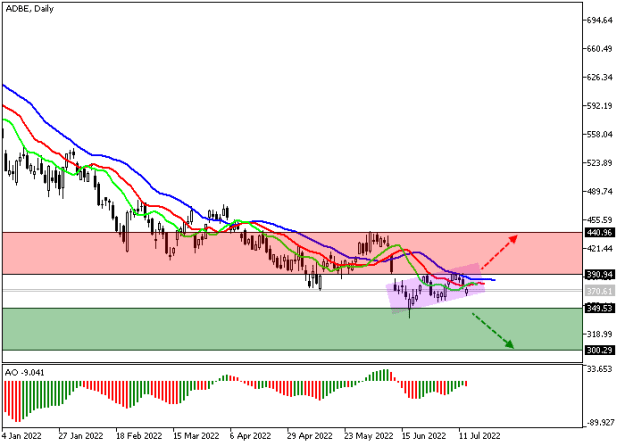
On the daily chart of the asset, a global downward channel is developing with dynamic boundaries of 130–230. Currently, the price has reached its support line, breaking the 100% underlying Fibonacci extension trend level at 160 and holding below. The 4-hour chart clearly shows that the downtrend could continue to the full 161.8% Fibonacci extension trend at 83. Before that, the trading instrument will need to break the year’s low of 140.
Attached Image (click to enlarge)

----------------------------------------------------------------------------------------
Solid ECN Securities
Account table > 1:1000 Leverage > Micro > ECN > Standard > Swap-free
Promotions > %30 Deposit bonus > Negative Balance Protection
solidecn.com
-----------------------------------------------------------------------------------------
instagram | facebook | twitter | linkedin