• Home
  • Forums
  • Trades
  • News
  • Calendar
  • Market
  • Brokers
  • Login
  • Join
  • User/Email: Password:
  • 8:33pm
Menu
  • Forums
  • Trades
  • News
  • Calendar
  • Market
  • Brokers
  • Login
  • Join
  • 8:33pm
Sister Sites
  • Metals Mine
  • Energy EXCH
  • Crypto Craft

Options

Bookmark Thread

First Page First Unread Last Page Last Post

Print Thread

Similar Threads

I will code your scalping EAs for no charge 55 replies

I will code your pivot EAs for no charge 20 replies

Need help to code EAs for MT4 and MT5 4 replies

EAs and indicators relating to moutaki... 22 replies

InterbankFX has loaded its MT4 platform with custom EAs, indicators and scripts 1 reply

  • Platform Tech
  • /
  • Reply to Thread
  • Subscribe
  • 41,125
Attachments: I will code your EAs and Indicators for no charge
Exit Attachments
Tags: I will code your EAs and Indicators for no charge
Cancel

I will code your EAs and Indicators for no charge

  • Last Post
  •  
  • 1 26172618Page 261926202621 2990
  • 1 Page 2619 2990
  •  
  • Post #52,361
  • Quote
  • May 24, 2022 7:35am May 24, 2022 7:35am
  •  tintep
  • Joined Nov 2019 | Status: Member | 226 Posts
Quoting tonyjustcom
Disliked
{quote} Thank you for your quick respond. I will like it in either way but it may not need to contain previous candle condition, as long as it give me best move in a particular time frame. And please i will appreciate if their is color selection for bullish or bearish and adjustment of size, including roll and Colum. Thank a lot.
Ignored

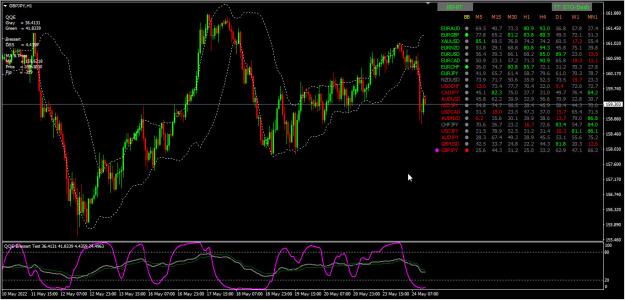
Hi tonyjustcom . Try this . use with this

1. color of sto = min max.
2. color of bb = close and open outside bb. and bb don't alert
3. color of pair = ma > ma2 and close > ma2 color = Bullcolor opposite for Bearcolor.
4. sort = (close - ma) .
5. alert = min or max > NoForAlert for example NoForAlert = 5 it mean if 5 timeframe sto max or min. it will alert

I limit 32 currency . for "bb and ma" I use default timeframe .
and you don't change indicator name . Sorry for my English .
Attached Image (click to enlarge)
Click to Enlarge

Name: 2022-05-24_184206.jpg
Size: 285 KB
Attached File(s)
File Type: ex4 BB-BT.ex4   17 KB | 123 downloads
File Type: ex4 TT STO Dash-BT.ex4   39 KB | 131 downloads
 
3
  • Post #52,362
  • Quote
  • May 24, 2022 9:17am May 24, 2022 9:17am
  •  tonyjustcom
  • | Joined Apr 2019 | Status: MEMBER | 66 Posts
Quoting tintep
Disliked
{quote} Hi tonyjustcom . Try this . use with this 1. color of sto = min max. 2. color of bb = close and open outside bb. and bb don't alert 3. color of pair = ma > ma2 and close > ma2 color = Bullcolor opposite for Bearcolor. 4. sort = (close - ma) . 5. alert = min or max > NoForAlert for example NoForAlert = 5 it mean if 5 timeframe sto max or min. it will alert I limit 32 currency . for "bb and ma" I use default timeframe . and you don't change indicator name . Sorry for my English . {file} {file} {image}
Ignored
This is a great work. Am really grateful Sir.
Though i noticed it did not display on my demo account and it display on my live account. Am curious to know why it is so.

Thank you tintep
 
 
  • Post #52,363
  • Quote
  • May 24, 2022 11:31am May 24, 2022 11:31am
  •  Samalin
  • Joined Apr 2017 | Status: Member | 675 Posts
Good day Coders and Traders, please i need help ,
i have always misunderstood the physical representation of the indicator named MA distance from price
i find it always in digital form and i cant understand how the digits is calculated,
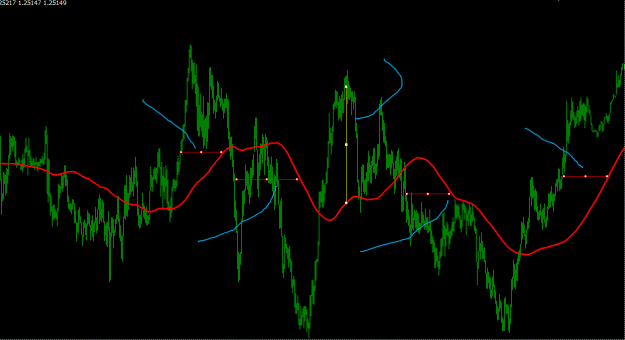
attached screenshot is a physical representation of MA distance from price, if this is the true form of the indicator how can i understand the calculation from when the price is close to the MA and when its far apart?
Attached Image (click to enlarge)
Click to Enlarge

Name: FF.png
Size: 16 KB
 
 
  • Post #52,364
  • Quote
  • May 24, 2022 11:43am May 24, 2022 11:43am
  •  tintep
  • Joined Nov 2019 | Status: Member | 226 Posts
Quoting tonyjustcom
Disliked
{quote} This is a great work.
Ignored
Hi tonyjustcom . Can you have picture with demo account? and This indicator can use auto suffix.
 
 
  • Post #52,365
  • Quote
  • May 24, 2022 12:47pm May 24, 2022 12:47pm
  •  tonyjustcom
  • | Joined Apr 2019 | Status: MEMBER | 66 Posts
Quoting tintep
Disliked
{quote} Hi tonyjustcom . Can you have picture with demo account? and This indicator can use auto suffix.
Ignored
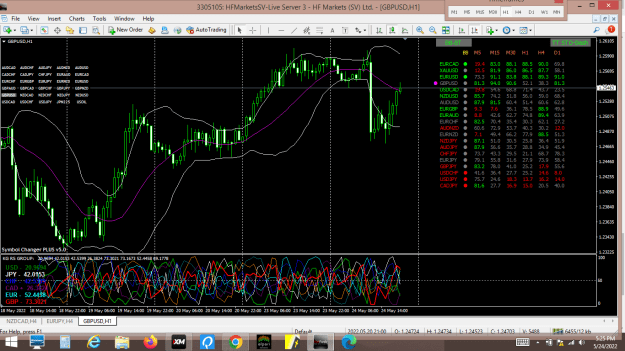
This one here is the live account.
Attached Image (click to enlarge)
Click to Enlarge

Name: screenshot.png
Size: 70 KB

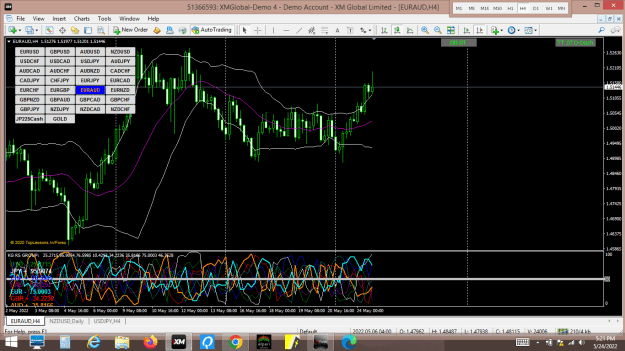
And this here is the demo account account.
Attached Image (click to enlarge)
Click to Enlarge

Name: screenshot.png
Size: 60 KB


This is a great indicator. Please can you make the pairs color different color from the values, So change in color does not affect pairs, when value change.
Also the decimal point, i will appreciate if is remove so to reduce the area size of indicator.
Once AGAIN THANK YOU.
 
 
  • Post #52,366
  • Quote
  • May 24, 2022 1:15pm May 24, 2022 1:15pm
  •  Tankk
  • Joined Sep 2021 | Status: ********* | 386 Posts
Quoting Wayun
Disliked
would you add more one choice on the input menu about the color of stochastic, The choice will be between "Change color on slope change Or Change color on Signal Cross"
Ignored
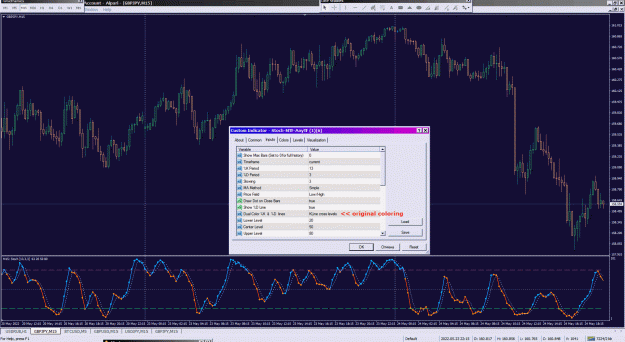
Stoch-MTF-AnyTF (1)(6)
thats all.. don't ask to modify it anymore: heavy inconvenient code: it's easier to write a new one
Attached Image (click to enlarge)
Click to Enlarge

Name: Stoch-MTF-AnyTF (1)(6).gif
Size: 315 KB
Attached File(s)
File Type: mq4 Stoch-MTF-AnyTF (1)(6).mq4   35 KB | 159 downloads
study indicator settings and test it well...
 
1
  • Post #52,367
  • Quote
  • May 24, 2022 10:25pm May 24, 2022 10:25pm
  •  tintep
  • Joined Nov 2019 | Status: Member | 226 Posts
Quoting tonyjustcom
Disliked
{quote} This one here is the live account.
Ignored
Hi tonyjustcom. I think your ploblem is it conflict with your symbol changer indicator. My indicator have " symbol changer" if you click pairs .
You don't use orther " symbol changer indicator."
 
1
  • Post #52,368
  • Quote
  • May 25, 2022 12:15am May 25, 2022 12:15am
  •  Wayun
  • | Joined May 2022 | Status: Member | 5 Posts
Quoting Tankk
Disliked
{quote} Stoch-MTF-AnyTF (1)(6) thats all.. don't ask to modify it anymore: heavy inconvenient code: it's easier to write a new one {image} {file}
Ignored
Thank you
Trade what you see NOT what you think!
 
1
  • Post #52,369
  • Quote
  • May 25, 2022 6:27am May 25, 2022 6:27am
  •  jonjon0711
  • | Joined Feb 2022 | Status: Member | 95 Posts
Quoting Tankk
Disliked
{quote} Stoch-MTF-AnyTF (1)(6) thats all.. don't ask to modify it anymore: heavy inconvenient code: it's easier to write a new one {image} {file}
Ignored
Infinite merit @tankk
 
1
  • Post #52,370
  • Quote
  • May 25, 2022 11:15am May 25, 2022 11:15am
  •  walesamuel
  • | Joined May 2018 | Status: Member | 48 Posts
Quoting jeanlouie
Disliked
{quote} Alert tf options are added, for tfs that are used inside the indicator, one signal per that particular tf candle time. Any combination can be used. {file}
Ignored

Many thanks for this John, you're the man.
If it works for you, don't forget to help others.
 
 
  • Post #52,371
  • Quote
  • May 25, 2022 11:29am May 25, 2022 11:29am
  •  shiva
  • Joined Aug 2007 | Status: Doing It In Dubai | 2,457 Posts
Hi mql champs, please help out with this, thank you.

I have an indicator that draws up/down arrows based on candle open/high/close etc, and I need it to plot the arrows even when the candle is still live, how do I do that?

if(Close[ii+1]<Open[ii+1]&&Close[ii]<Open[ii]&&Close[ii]<Low[ii+1]) //is short
{
dDownBuffer[ii] = High[ii] + 1.5 * MarketInfo(Symbol(),MODE_POINT);

// }


}
 
 
  • Post #52,372
  • Quote
  • May 25, 2022 1:37pm May 25, 2022 1:37pm
  •  jeanlouie
  • Joined Dec 2010 | Status: Member | 1,500 Posts
Quoting shiva
Disliked
...need it to plot the arrows even when the candle is still live, how do I do that?...
Ignored
- did you write this?
- to insert a chunk of code there is a little button on the top right of the new post window, </>, click it and paste a short bit of code in, or upload the entire mq4 file
- you haven't shown the settings of the ii loop you're using, you may have the end of the loop stopping at candle 1, not candle 0, when you fix this, you'll have to add an else statement to falsify drawing an arrow on the live candle, as the ohlc values of the live candle are being used and an arrow may not be valid anymore

Additional unsolicited thoughts-
- to better debug this yourself in future, forget any special conditions to draw a buffer, run through the whole chart putting a buffer on say the close of every candle, to see where your loop is stopping, or rather double check the for() settings are what you want
- I wouldn't recommend using ii as a counter, you're probably already using i, adding ii as a second loop somewhere will fuzzy things up, I'd use j or k instead of eyeballing i and ii then iii etc
- you can use a predefined variable of _Point instead of getting it through marketinfo()
- I'd recommend instead of a fixed gap multiple of 1.5*point, which is the same distance on 1min and 1day tf, you use candle size, like replace 1.5*point with 0.5*wicksize, so the same relative gap appears regardless of tf and price scale
 
 
  • Post #52,373
  • Quote
  • May 25, 2022 1:56pm May 25, 2022 1:56pm
  •  harry_tn
  • | Joined Jun 2008 | Status: Member | 54 Posts
Hello everyone, Greetings!

I need some expert help to correct the following code for my EA code for yesterday's high and low, previous day's high and low, and previous day's high and low.

Below is my code:

YestDayHi = High[iHighest (TradeSymbol,PERIOD_D1,MODE_HIGH,1,1)];
YestDayLo = Low [iLowest (TradeSymbol,PERIOD_D1,MODE_LOW, 1,1)];

PrevDayHi = High[iHighest (TradeSymbol,PERIOD_D1,MODE_HIGH,2,1)];
PrevDayLo = Low [iLowest (TradeSymbol,PERIOD_D1,MODE_LOW, 2,1)];

PPrevDayHi= High[iHighest(TradeSymbol,PERIOD_D1,MODE_HIGH,3,1)];
PPrevDayLo= Low [iLowest (TradeSymbol,PERIOD_D1,MODE_LOW, 3,1)];

Thank you
 
 
  • Post #52,374
  • Quote
  • May 25, 2022 3:28pm May 25, 2022 3:28pm
  •  Polleczko
  • | Joined Jun 2011 | Status: Member | 71 Posts
Hi Guys,

would it be possible to add alerts to ASC Trend Indi?

MT4/Email/Mobile if possible.

Thanks!

Best regards
Paul
Attached File(s)
File Type: mq4 ASCTrend1i.mq4   4 KB | 85 downloads
 
 
  • Post #52,375
  • Quote
  • May 25, 2022 3:37pm May 25, 2022 3:37pm
  •  jeanlouie
  • Joined Dec 2010 | Status: Member | 1,500 Posts
Quoting harry_tn
Disliked
...code for yesterday's high and low, previous day's high and low, and previous day's high and low...
Ignored
- to insert a chunk of code there is a little button on the top right of the new post window, </>
- in your ihighest/ilowest, you keep starting from index 1, and changing the count parameter, re-read the documentation for it
- you cant use the result of ihighest/ilowest as an index for high/low[], you're on a different tf
- you can just use iO/H/L/Close() instead with the symbol/tf/index you want, if the return value is an error, then the tf data doesnt exist and is being loaded, just recall it on the next tick
- if you want to stick to the current chart without calling/waiting for mtf data, loop back from the live candle's high/low, and save any higher/lower price, reset the high/low var on each new day, check a new day via timedayofweek()
 
 
  • Post #52,376
  • Quote
  • May 25, 2022 3:42pm May 25, 2022 3:42pm
  •  shiva
  • Joined Aug 2007 | Status: Doing It In Dubai | 2,457 Posts
Quoting jeanlouie
Disliked
{quote} - did you write this? - to insert a chunk of code there is a little button on the top right of the new post window, </>, click it and paste a short bit of code in, or upload the entire mq4 file - you haven't shown the settings of the ii loop you're using, you may have the end of the loop stopping at candle 1, not candle 0, when you fix this, you'll have to add an else statement to falsify drawing an arrow on the live candle, as the ohlc values of the live candle are being used and an arrow may not be valid anymore Additional unsolicited...
Ignored
Oi Jeannie, since you know your thoughts are unsolicited, how about you keep them where they belong? In an unsolicted place where the Sun does not shine.
 
 
  • Post #52,377
  • Quote
  • May 25, 2022 3:44pm May 25, 2022 3:44pm
  •  shiva
  • Joined Aug 2007 | Status: Doing It In Dubai | 2,457 Posts
Quoting jeanlouie
Disliked
{quote} - to insert a chunk of code there is a little button on the top right of the new post window, </> - in your ihighest/ilowest, you keep starting from index 1, and changing the count parameter, re-read the documentation for it - you cant use the result of ihighest/ilowest as an index for high/low[], you're on a different tf - you can just use iO/H/L/Close() instead with the symbol/tf/index you want, if the return value is an error, then the tf data doesnt exist and is being loaded, just recall it on the next tick - if you want to stick to...
Ignored
Mother hen wants to lecture everyone. lol
 
 
  • Post #52,378
  • Quote
  • May 25, 2022 4:22pm May 25, 2022 4:22pm
  •  jeanlouie
  • Joined Dec 2010 | Status: Member | 1,500 Posts
Quoting shiva
Disliked
{quote} Oi Jeannie, since you know your thoughts are unsolicited, how about you keep them where they belong? In an unsolicted place where the Sun does not shine.
Ignored
I'm surprised you took a post with several points helping you out, offensively. In case you didn't bother to read it, point 3 is most likely your specific issue, but as I also noted you didn't provide enough info.

Quoting shiva
Disliked
{quote} Mother hen wants to lecture everyone. lol
Ignored
People like you baffle me. Ask for pointers but are so sensitive they take a useful response as some kind of insult.
 
 
  • Post #52,379
  • Quote
  • May 25, 2022 11:32pm May 25, 2022 11:32pm
  •  Mgdamle
  • | Joined Dec 2018 | Status: Member | 19 Posts
Hi
Looking for EA with below parameters for INDICIES mainly
TF 1M 5M 15M
Buy at or below last swing low after 8.30am NY time
SL below session swing low
TP @ or above session swing high
And
Sell at or above last swing high after 8.30am NY time
SL above session swing high
TP @ or below session swing low
This is base on ICT Free Mentorship
or any already available EA in this type
Thanks in Advance
Mohan
 
 
  • Post #52,380
  • Quote
  • May 26, 2022 12:27am May 26, 2022 12:27am
  •  fxganstah
  • | Joined Dec 2010 | Status: Member | 52 Posts
Hi guys

I am looking for probably something simple and cant find it anywhere online anymore.

There used to be a FREE indicator on the MT4 marketplace called "Make It Horizontal" - where you can draw a line using the Trendline tool and then press "h" on your keyboard, and it would make that trendline perfectly straight (horizontal). This usually helps when you are drawing small S/R ranges and dont want to use the full Horizontal Line tool from the toolbar. I hope this makes sense?

This indicator does not exist anymore and am looking to see if anyone has something similar or can be easily coded?

Cheers
 
 
  • Platform Tech
  • /
  • I will code your EAs and Indicators for no charge
  • Reply to Thread
    • 1 26172618Page 261926202621 2990
    • 1 Page 2619 2990
19 traders viewing now, 4 are members:
Pipi5
,
classy
,
talaate
,
Invisible
  • More
Top of Page
  • Facebook
  • Twitter
About FF
  • Mission
  • Products
  • User Guide
  • Media Kit
  • Blog
  • Contact
FF Products
  • Forums
  • Trades
  • Calendar
  • News
  • Market
  • Brokers
  • Trade Explorer
FF Website
  • Homepage
  • Search
  • Members
  • Report a Bug
Follow FF
  • Facebook
  • Twitter

FF Sister Sites:

  • Metals Mine
  • Energy EXCH
  • Crypto Craft

Forex Factory® is a brand of Fair Economy, Inc.

Terms of Service / ©2023