{quote} I would be interested to know by what rules you decided there was no trade on the first of those opportunities you marked? If using just the GMMA approach, you had a long period of very tight consolidation and a big breakout. The consolidation would have been a sign to watch for the breakout. So as soon as you saw the lines beginning to diverge and show open space between them you could have entered. If you were quick, or lucky, you could have got in on those small bars before the big move up. If you notice, they represent a short pullback...
Ignored
Thanks buddy.
Reasons for not entering rally was rsi, it sat on 80 right through the rally.
GMMA rules did not permit to enter sell off / retracement. No cross over, candles were right inside LT guppies.
Correct where am I wrong?
TIA
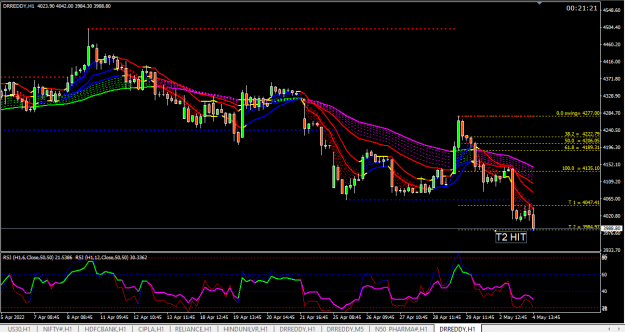
Spudfan, need your comments on this, today GJ {image}
Ignored
this is a good chart to trade. its a healthy uptrend with retracement to LT guppy. i would wait for rsi crossover and both to go above 50 (change color to lime) and candle to close above all short term guppys (as you are not using 10 ema channel) to go long.
may i suggest you use ma in color indicator to chart your guppys. just by change in color makes it a leading indicator signifying change in trend.
i personally find rsi very reliable indicator to make decisions.
1) long only if both rsi > 50, short if < 50
2) 60 to 80 is strong uptrend , 40 to 20 is strong downtrend. remain tn the trade in these levels.
3) above 80 or below 20 is extreme over bought or over sold levels. trail your stoploss to previous candle high/ low
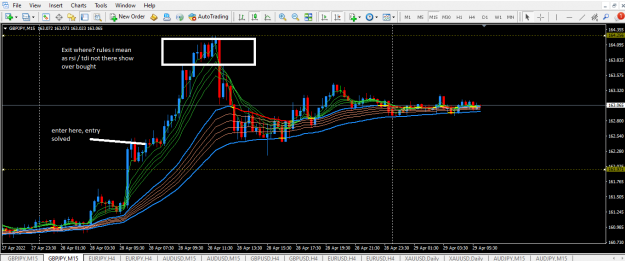
Spudfan, You are right. Without rsi / tdi, I should have entered, where I drew line.
Big issue of entry is solved well and truly. But where to exit? pips? zone?
{quote} this is a good chart to trade. its a healthy uptrend with retracement to LT guppy. i would wait for rsi crossover and both to go above 50 (change color to lime) and candle to close above all short term guppys (as you are not using 10 ema channel) to go long. may i suggest you use ma in color indicator to chart your guppys. just by change in color makes it a leading indicator signifying change in trend.
Ignored
Thanks Rajesh, I posted without reading this post.
How do i change the color of ma or where do i find that indi?
And in that GJ trade, rsi sat on 80 level, throughout the rally. How do I enter and where?
As much as I do not want you or Spudfan to spoon feed me, Im looking at your thought process.
TIA
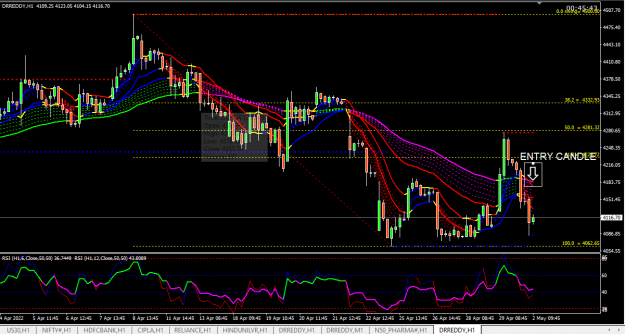
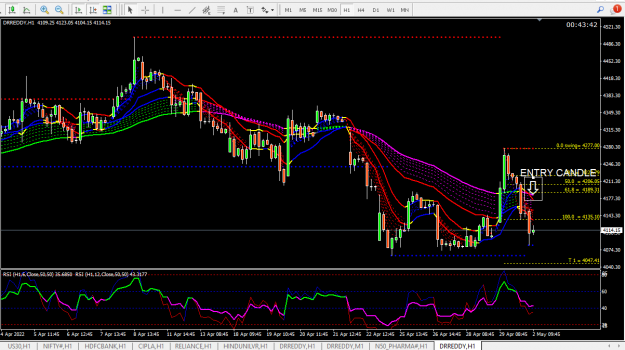
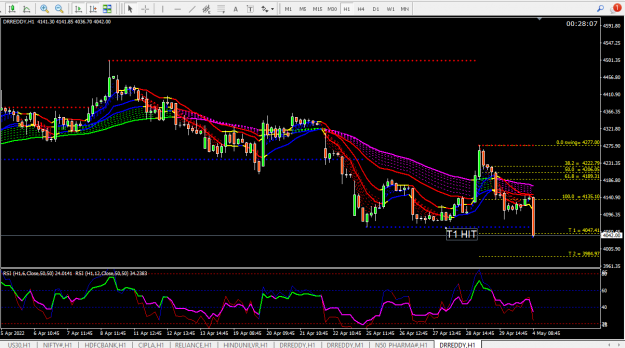
I started trading GUPPY MMA method after reading this thread itself. over a period of time i made few modifications to suit my trading personality. especially the entry and exits. By profession i am a cancer surgeon, so cant spend too much time on screen. i cannot use EA as no broker in india allow thading via MT4 platform. Here is my chart and templete with all indicators. {image}{file}{file}{file}{file}{file} {file} {file} {file}
{quote} this is a good chart to trade. its a healthy uptrend with retracement to LT guppy. i would wait for rsi crossover and both to go above 50 (change color to lime) and candle to close above all short term guppys (as you are not using 10 ema channel) to go long. may i suggest you use ma in color indicator to chart your guppys. just by change in color makes it a leading indicator signifying change in trend.
Ignored
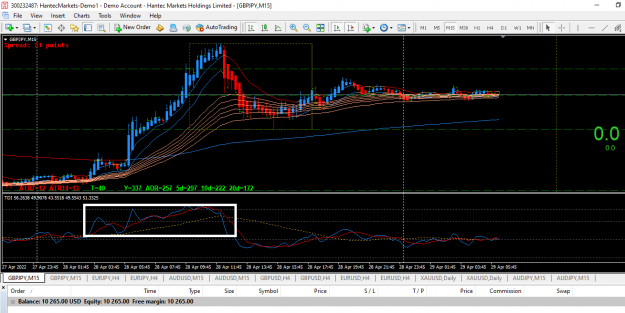
Rajesh, Im using to 10 ema channel in another window with TDI.
Observe how even TDI sat in over bought zone.
If I take tdi out, i know i could have drivel ema 10 channel up. The question again is exit, if I do it.
{quote} And in that GJ trade, rsi sat on 80 level, throughout the rally.
Ignored
1) rsi has to cross 50 level when the rally started. that is the candle you have to identify in real time.
2) if rsi is > 80 throughout the rally you trail your stoploss to previous candle low.
{quote} 1) rsi has to cross 50 level when the rally started. that is the candle you have to identify in real time. 2) if rsi is > 80 throughout the rally you trail your stoploss to previous candle low.
Ignored
This will surely sort out an issue. I should have had 3 trades, 2 in profits, last at break even.
Thanks Rajesh
Rajesh, Will surely re read all your posts again and ask if needs arise.
How do you select an asset / instrument to trade.
1. Average daily range, say over 10-20 days?
2. Yesterday volume?
3. News events scheduled?
4. Yesterday open and close?
Spudfan, Your inputs help more as you trade FX exclusively.
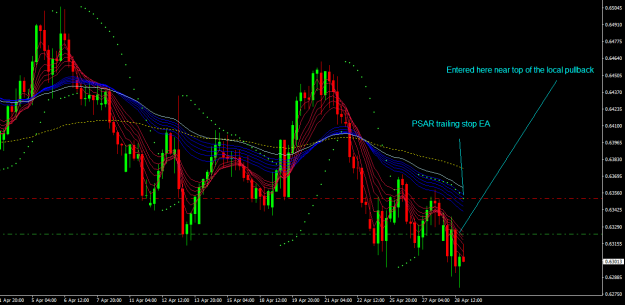
Spudfan, You are right. Without rsi / tdi, I should have entered, where I drew line. Big issue of entry is solved well and truly. But where to exit? pips? zone? Rajesh, your inputs please, on rsi usage also. TIA {image}
Ignored
If you don't receive the gift of a basket of trades that you can treat as a collective, as I hope for every day, then each trade needs to be managed individually. Exiting is actually one of the more difficult parts of trading because there's no magic formula. Rajesh has a clearly worked out strategy, so have a look at that in the source document. It's a good strategy, it's not perfect (perfect doesn't exist), but it works and it's clearly formulated. That's about as good as it gets.
My approach is to set an ambitious but still realistic fixed target and then to trail the stop. "Ambitious" is a number at the larger end of, or a bit beyond, what most trailed stops will achieve. Have a look at the PSAR dots - they make it easy to figure out what a "standard" trade looks lke using that trailing stop method. If I'm lucky, price will reach that target, and if not, the trailing stop will still bring in something. The problem with a trailing stop is that price usually goes much further than the trailed stop and then retraces, so you exit with much less profit than price actually reached.
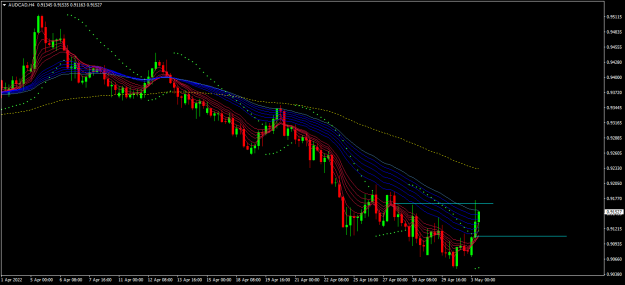
My AUDCAD trade that I posted about yesterday reached 90 pips but has since been retracing. I kind of "knew" I should close at 90 pips, but had previously decided to let it run and see what happens. Well, what is happening is that the stop is currently sitting at 19 pips in profit. In three hours' time it will be moved down to about 26 pips, which is more or less where I expect it to be stopped out.
Another idea for you is to go for easily achievable fixed targets with some of your trades and then choose one to trail for as far as it will go. In this way I banked about 1.7% profit on two trades yesterday and left AUDCAD to run. NZDCHF, which I placed later, has just been stopped out for a 14 pip loss.
{quote} Thanks Rajesh, I posted without reading this post. How do i change the color of ma or where do i find that indi? And in that GJ trade, rsi sat on 80 level, throughout the rally. How do I enter and where? As much as I do not want you or Spudfan to spoon feed me, Im looking at your thought process. TIA
Ignored
I have attached some that I reworked to make things easier for myself. I haven't looked at them for a while but I'm pretty sure they are correct.
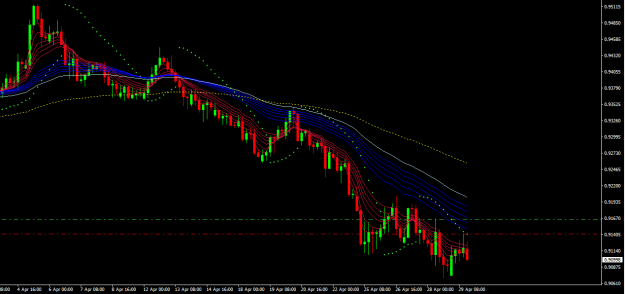
My AUDCAD trade only just survived being stopped out (the previous PSAR dot) but now it looks like it's going on another big drop down, I hope so. {image}
Ignored
Stopped out at my trailed stop for 58 pips. The entry and close are marked on the chart. On Friday I changed the PSAR Max setting to 0.1, which means it doesn't track price movements quite as closely. It did save me from being stopped out earlier, but the overnight bullish spike was decisive. Dreams of a long bearish run died! Nothing I could do about it.