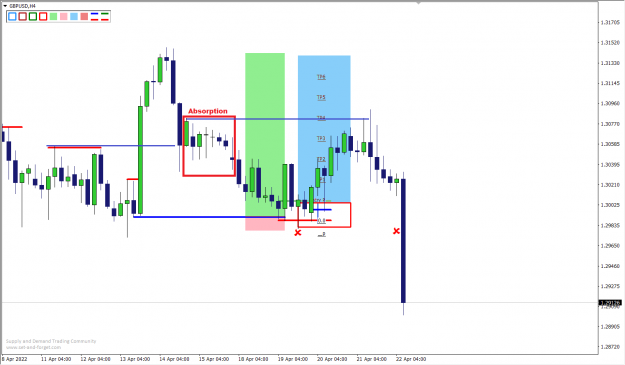
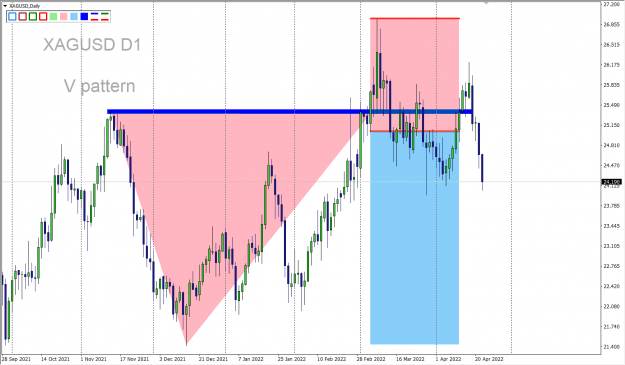
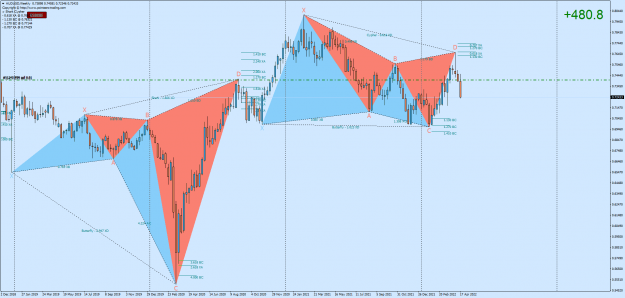
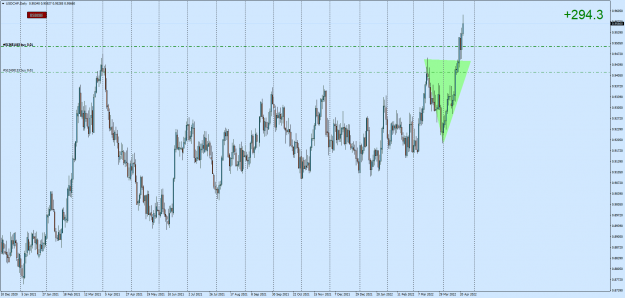
Spotted this setup on gold this morning.Its amazing how this setup plays out. {image}
Ignored
THE MOST IMPORTANT IS RISKREWARD MY BRO now you should trade 100 trade
WITHIN 70% Acurrency with 2 to one RR
you'r having an amasing income weekly , monthly my bro
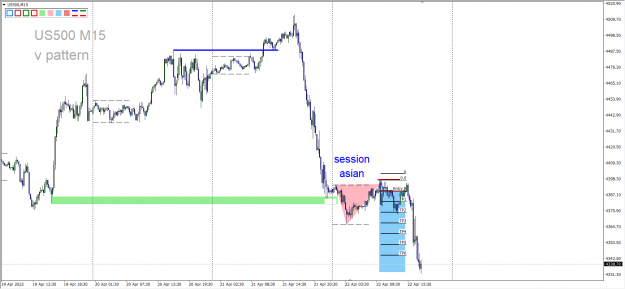
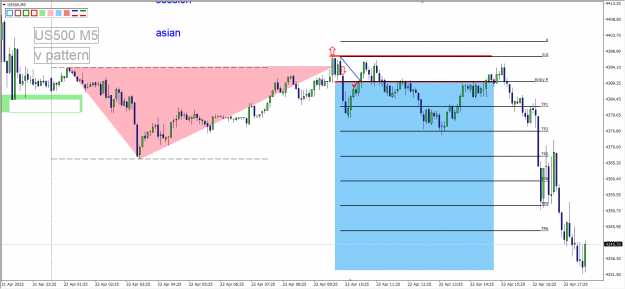
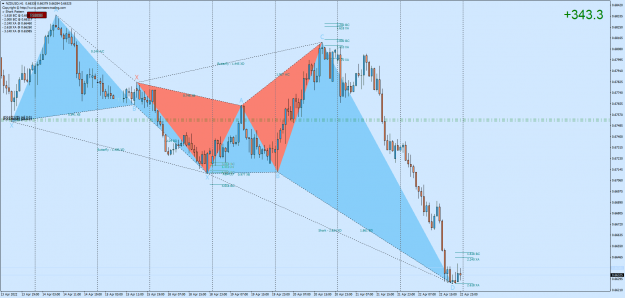
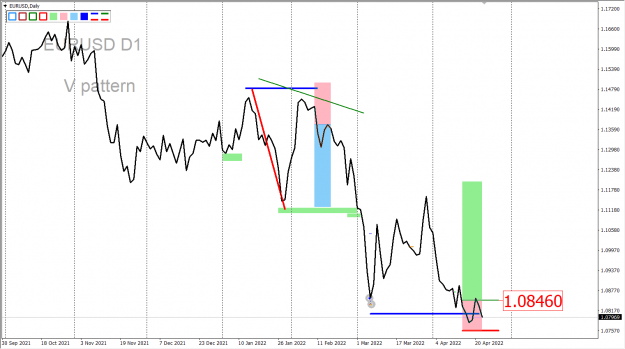
I became skeptical of price going beyond the stops above the Absorption zone (where supply won the battle). From a HTF point of view price is still heading down for the Low that broke the Resistance (to form an inverted V).
Your thread is being followed by many traders. Glad to see you sharing good strategy for everyone. I won't post much here! If you are looking for an experienced MQL4/MQL5 programmer. I could be one of them. You can find me on MQL5 site, telegram or my thread.
{quote} I became skeptical of price going beyond the stops above the Absorption zone (where supply won the battle). From a HTF point of view price is still heading down for the Low that broke the Resistance (to form an inverted V). {image} {image}
Ignored
you are right i'm hawain not Swiss never look 4 the prefection look4 the simpecity
its a huge to trade on monthly let's wait another setup no problem
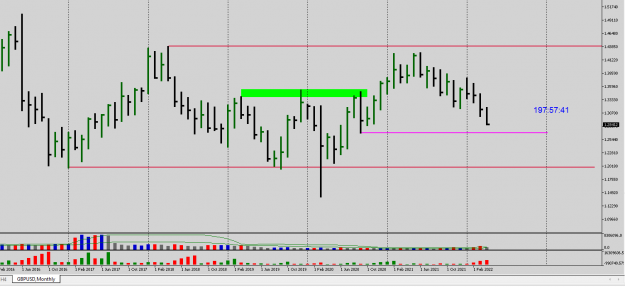
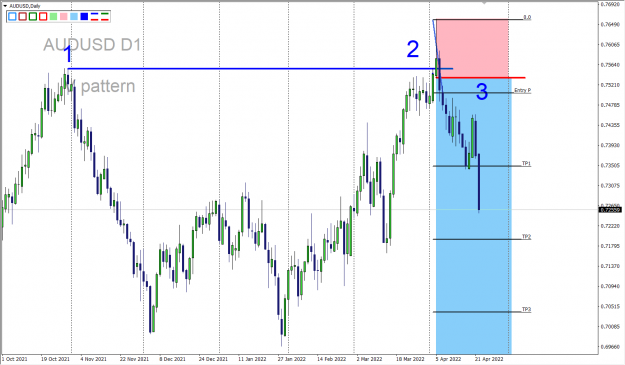
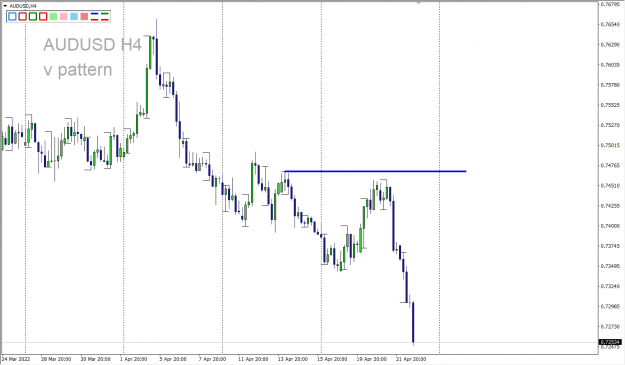
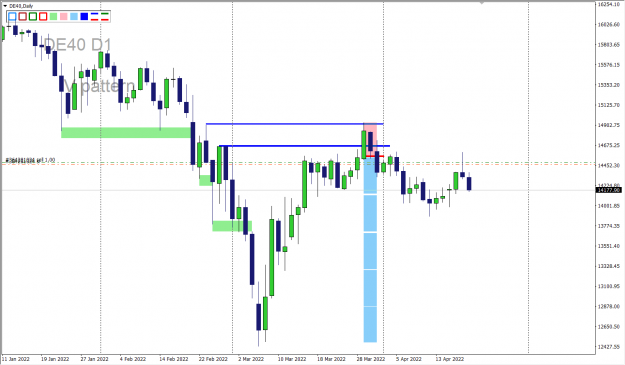
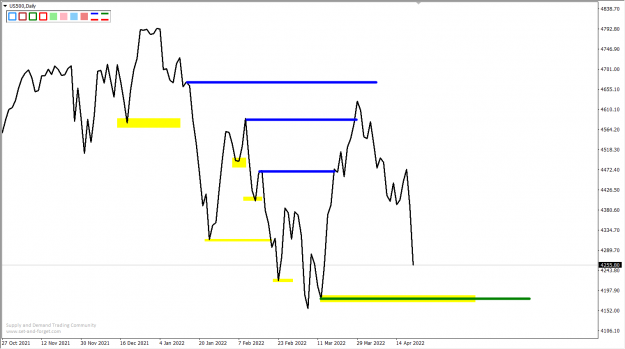
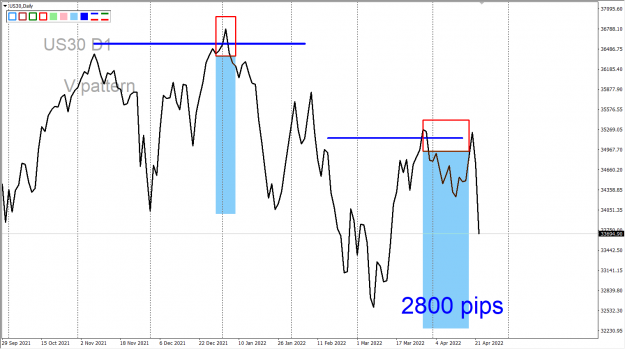
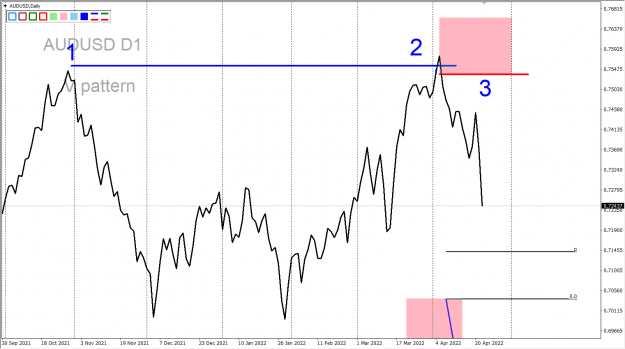
{quote} Here's my take on this (imo, bad) setup. First thing I noticed was on the higher TF, a very obvious level, marked in blue. {image} Moving to your entry TF, you decided for some reason to take a minor high, where looking left on the previous day was the real high that was at the origin of the down move of the potential V pattern. Also, the momentum up to your minor high was very strong, indicating potential continuation. It's basic price action, but something to add into the analysis here. {image} So, you basically have: A much stronger HTF...
Ignored
I must agree with you. Emma's V Pattern works as a sign. It is safer to use the Sign with the Context in mind otherwise one might see and trade all the V's including the ones that should be ignored.
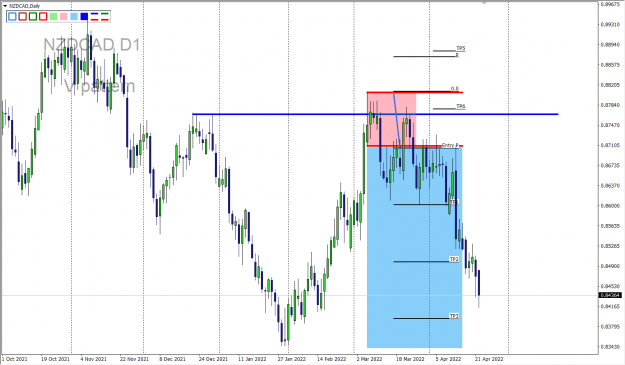
{quote} No, it is not a valid V pattern. You have to look at the highs formed before the breakout of support inorder to mark that level with your horizontal line. {image}
Ignored
thanks alot keep guiding me in future as well please
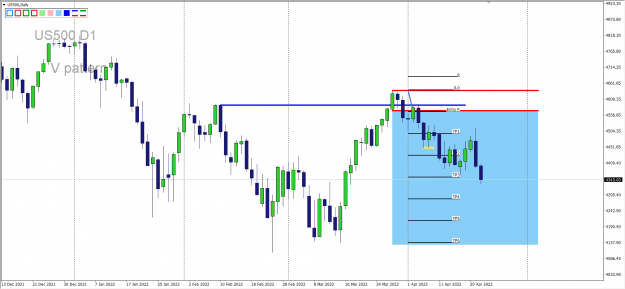
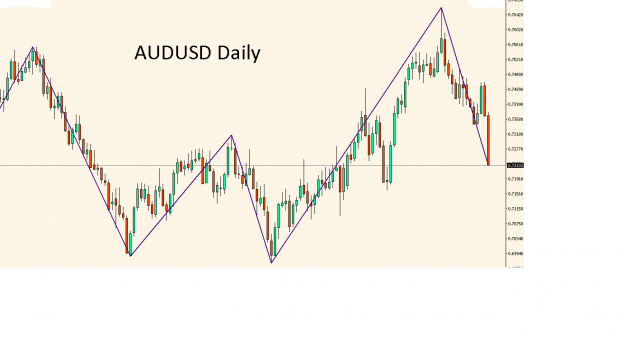
Perhaps using the zig-zag indicator would make it easier to identify the V (or W). This AUDUSD Daily as shown a few posts above is also a W. The zig-zag also makes it easier to see when the original high is broken. Enjoy your sell!
interesting analyses here
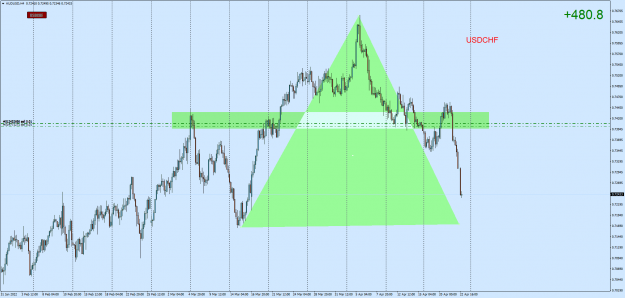
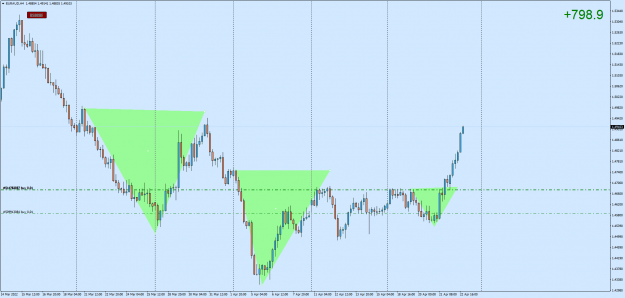
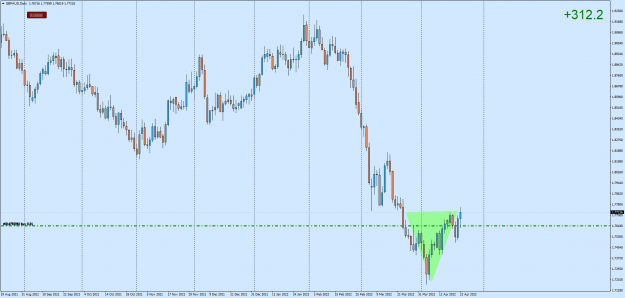
I also do patterns on the side, for me the v formations are coincidence and the triangles.
I think that results in rising prices and falling prices with a lot of volume.
Perhaps using the zig-zag indicator would make it easier to identify the V (or W). This AUDUSD Daily as shown a few posts above is also a W. The zig-zag also makes it easier to see when the original high is broken. Enjoy your sell! {image}
Ignored
This thread deals with V Pattern rules, AND KEEP iT SIMPLE No indicators are allowed on the charts,
no TMA ,CCI, RSI no Bollinger Bands or EMA crosses, ETC .
THANKS FOR UNDERSTAND AND HELP US TO KEEP SIMPLE
Attached Image (click to enlarge)
UOU CAN CHOSE CHART LINE MUCH BETTER THANM ZIGZAAAAAAAAAGGGGGG
interesting analyses here I also do patterns on the side, for me the v formations are coincidence and the triangles. I think that results in rising prices and falling prices with a lot of volume. {image} {image} {image} {image}
Ignored
I RESPECT ALL TIP OF STRATEGYES AND ANALYSIS & VIEWS
THAT GIVE CONTEXT TO YOU AND ALL OF US AS TRADER WE SHOULD UNDERSTAND AND MAKE ANALYSIS
BUT HONESTLY I ADVICE U THAT LOSING YOUR TIME ANALYSING
YOU ARE NOT OBLEGATED TO FOLLOW MY THREAD BUT I`VE BEEN LEARNT THE MOST IMPORTANT TRADING SCHOOL
HARMONIC , SUPP& DEMA , SMART MONEY , TRADE MADE SIMPLE ALL KIND OF EMAS & INDICATOR
LET´S SAY IT WAS THE PRICE TO GIVE TO BE WHO IS AIM NOW
AFTER A LOT years and hundreds of hours of TRADING experience behind HIM
I CAN TELL U IF THINGS ARE MORE SIMPLE IS MUCH BETTER
I OPEND THIS THREAD TO GUIDE EXPERIENCED & NEWBEES TRADERS AS WELL AND I HAVE TO SPEAK
WITH YOU EGO FIRST BEFORE SEPEAK WITH YOU
ACCEPT THIS TRUTH THAT AFTER ALL THAT YOU´VE LEARNT AT UNIVERSTY AND SCHOOL IS NOT VALID TO GUIDE YOU IN REAL LIFE
SAME THING IN TRADING BOOKS , COURSES & VIDEOS WORKS FOR SMART TRADER
WHO CATCH THE POINT OF THIER OWN VIEW AND LEARNT FORM REAL MARKET CAOS
FOLLOW THE RULE AND LEAVE UR EGO AWAY IN TRADING
FOLLOW WHICH GIVES U PROFITS & MONEY NOT THE REASON
MY IDEAL PERSON ALWAYS TELL ME YOU WANT TO HAVE MONEY OR HAVE THE REASON AND WIN THGE DISSCUTION
I WANT TO WIN IN TRADING NOT WHO HAS THE REASON
MUCH ALOHA This thread deals with V Pattern rules, AND KEEP iT SIMPLE No indicators are allowed on the charts,
no TMA ,CCI, RSI no Bollinger Bands or EMA crosses, ETC .
Perhaps using the zig-zag indicator would make it easier to identify the V (or W). This AUDUSD Daily as shown a few posts above is also a W. The zig-zag also makes it easier to see when the original high is broken. Enjoy your sell! {image}
{quote} I RESPECT ALL TIP OF STRATEGYES AND ANALYSIS & VIEWS THAT GIVE CONTEXT TO YOU AND ALL OF US AS TRADER WE SHOULD UNDERSTAND AND MAKE ANALYSIS BUT HONESTLY I ADVICE U THAT LOSING YOUR TIME ANALYSING YOU ARE NOT OBLEGATED TO FOLLOW MY THREAD BUT I`VE BEEN LEARNT THE MOST IMPORTANT TRADING SCHOOL HARMONIC , SUPP& DEMA , SMART MONEY , TRADE MADE SIMPLE ALL KIND OF EMAS & INDICATOR LET´S SAY IT WAS THE PRICE TO GIVE TO BE WHO IS AIM NOW AFTER A LOT years and hundreds of hours of TRADING experience behind HIM I CAN TELL U IF THINGS ARE MORE SIMPLE...
Ignored
trading simple is the best way.
I also never trade on a chart in the past.
always up to date.