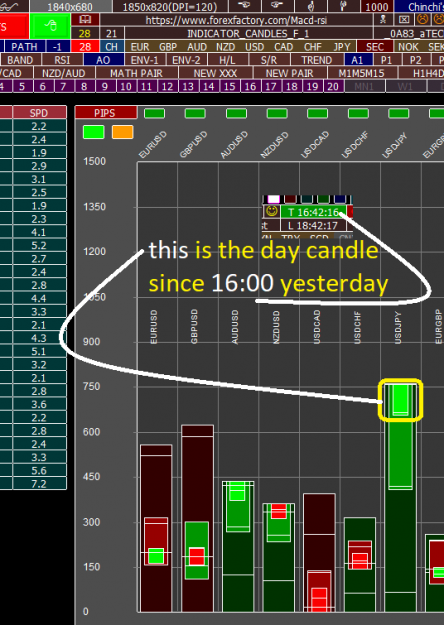
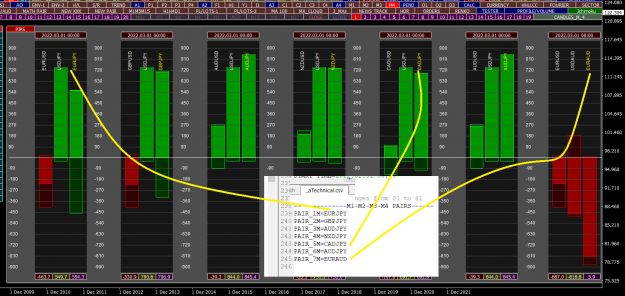
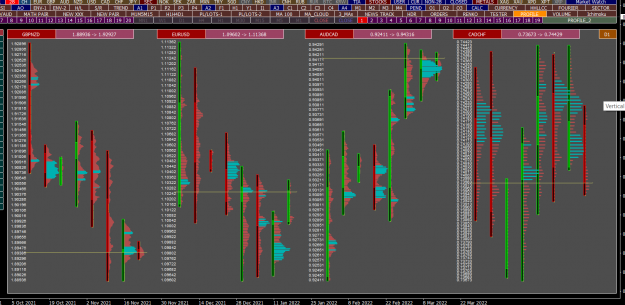
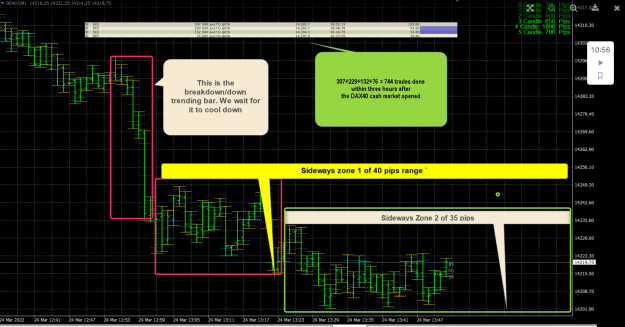
each day 10%,,,, https://www.forexfactory.com/thread/1371538
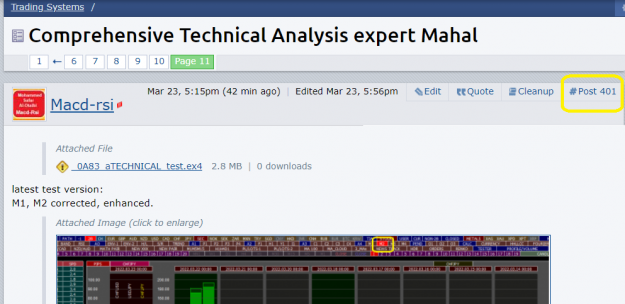
 Comprehensive Technical Analysis expert Mahal
- #401
- Edited 9:56am Mar 23, 2022 9:15am | Edited 9:56am
- Joined Oct 2019 | Status: Forexian Fighter = FF | 16,341 Posts
- #402
- Mar 23, 2022 9:16am Mar 23, 2022 9:16am
- Joined Oct 2019 | Status: Forexian Fighter = FF | 16,341 Posts
each day 10%,,,, https://www.forexfactory.com/thread/1371538
- #403
- Mar 23, 2022 9:57am Mar 23, 2022 9:57am
- Joined Oct 2019 | Status: Forexian Fighter = FF | 16,341 Posts
each day 10%,,,, https://www.forexfactory.com/thread/1371538
- #404
- Mar 23, 2022 10:02am Mar 23, 2022 10:02am
- Joined Oct 2019 | Status: Forexian Fighter = FF | 16,341 Posts
each day 10%,,,, https://www.forexfactory.com/thread/1371538
- #405
- Mar 23, 2022 12:32pm Mar 23, 2022 12:32pm
- Joined Oct 2019 | Status: Forexian Fighter = FF | 16,341 Posts
each day 10%,,,, https://www.forexfactory.com/thread/1371538
- #406
- Mar 23, 2022 1:37pm Mar 23, 2022 1:37pm
- Joined Oct 2019 | Status: Forexian Fighter = FF | 16,341 Posts
each day 10%,,,, https://www.forexfactory.com/thread/1371538
- #408
- Mar 24, 2022 12:08am Mar 24, 2022 12:08am
- Joined Oct 2019 | Status: Forexian Fighter = FF | 16,341 Posts
each day 10%,,,, https://www.forexfactory.com/thread/1371538
- #411
- Mar 24, 2022 10:30am Mar 24, 2022 10:30am
- Joined Oct 2019 | Status: Forexian Fighter = FF | 16,341 Posts
each day 10%,,,, https://www.forexfactory.com/thread/1371538
- #412
- Mar 24, 2022 10:34am Mar 24, 2022 10:34am
- Joined Oct 2019 | Status: Forexian Fighter = FF | 16,341 Posts
each day 10%,,,, https://www.forexfactory.com/thread/1371538
- #413
- Mar 24, 2022 10:38am Mar 24, 2022 10:38am
- Joined Oct 2019 | Status: Forexian Fighter = FF | 16,341 Posts
each day 10%,,,, https://www.forexfactory.com/thread/1371538
- #414
- Mar 24, 2022 12:21pm Mar 24, 2022 12:21pm
- Joined Oct 2019 | Status: Forexian Fighter = FF | 16,341 Posts
each day 10%,,,, https://www.forexfactory.com/thread/1371538
- #415
- Mar 24, 2022 3:10pm Mar 24, 2022 3:10pm
- Joined Oct 2019 | Status: Forexian Fighter = FF | 16,341 Posts
each day 10%,,,, https://www.forexfactory.com/thread/1371538
- #416
- Mar 24, 2022 4:26pm Mar 24, 2022 4:26pm
- Joined Oct 2019 | Status: Forexian Fighter = FF | 16,341 Posts
each day 10%,,,, https://www.forexfactory.com/thread/1371538
- #417
- Mar 24, 2022 10:10pm Mar 24, 2022 10:10pm
- Joined Oct 2019 | Status: Forexian Fighter = FF | 16,341 Posts
each day 10%,,,, https://www.forexfactory.com/thread/1371538
- #418
- Mar 25, 2022 1:06am Mar 25, 2022 1:06am
- Joined Nov 2015 | Status: Trader | 2,525 Posts
Practice makes a person perfect
- #419
- Mar 25, 2022 1:32am Mar 25, 2022 1:32am
- Joined Nov 2015 | Status: Trader | 2,525 Posts
Practice makes a person perfect
- #420
- Mar 25, 2022 3:59am Mar 25, 2022 3:59am
- Joined Oct 2019 | Status: Forexian Fighter = FF | 16,341 Posts
each day 10%,,,, https://www.forexfactory.com/thread/1371538