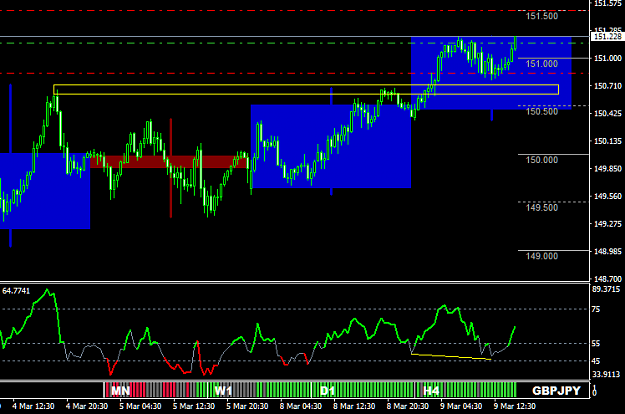
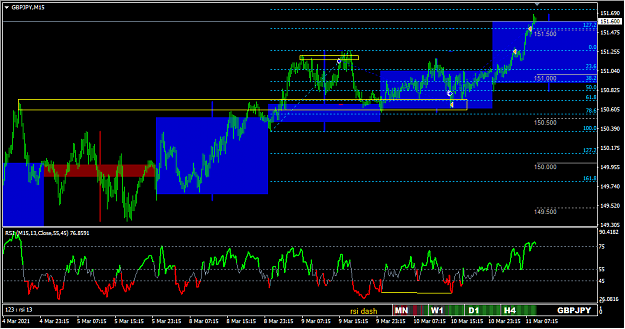
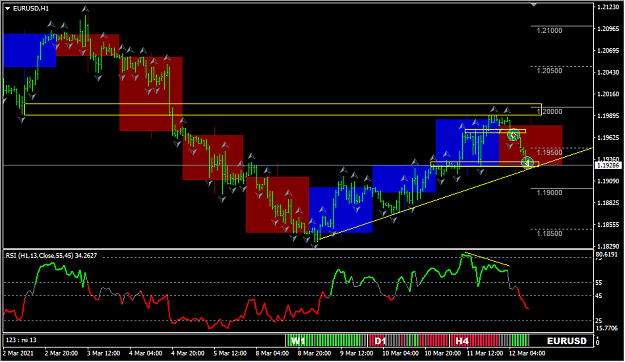
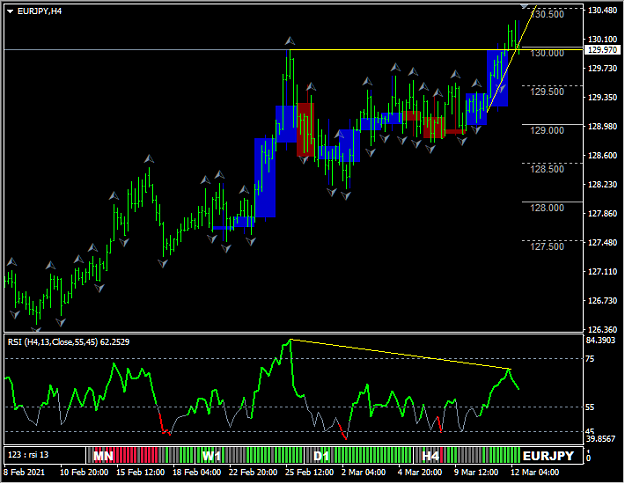
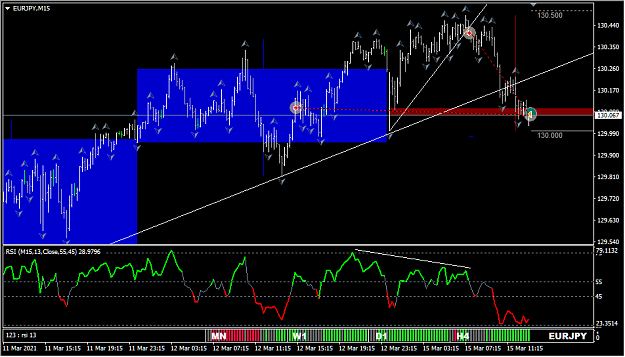
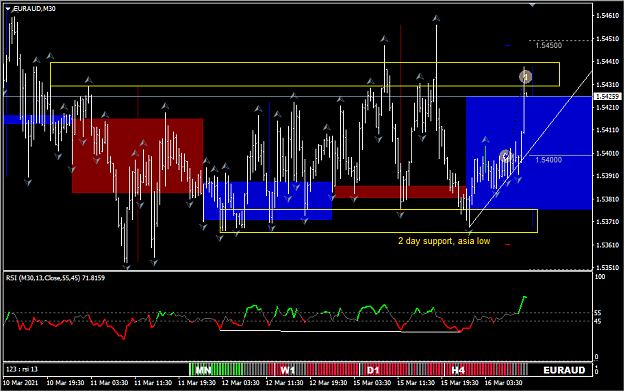
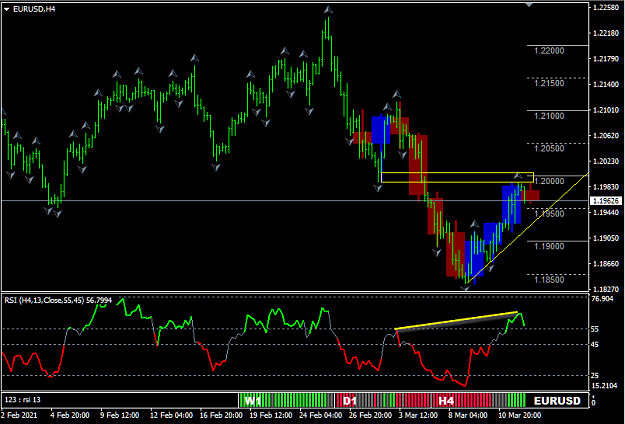
first buy encountered resistance and took a loss.
second and third buy due to rsi dash trend still all green.
entries on pullback to support and 61.8 fib with hidden divergence.
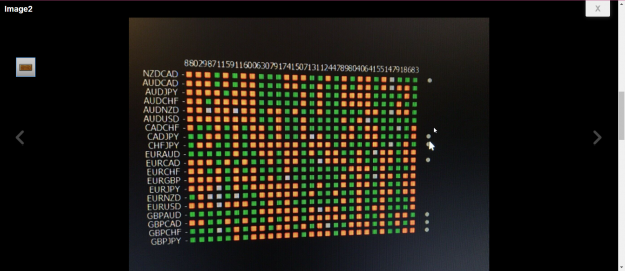
{quote} Updated.. if all C0/latest bar RSI values for all time frame are overbought or oversold, it will display boxed symbol name with green - oversold, red - overbought. But, it will be very rare to have all RSI value to be in overbought or oversold area if set to have 30/70. example pic is for oversold / overbought as 45/55 for demo purpose {image} {file}
{quote} Here, I have added Weekly and Monthly as optional. For D1 - MN1, you have to enable as default is false. {file}
Ignored
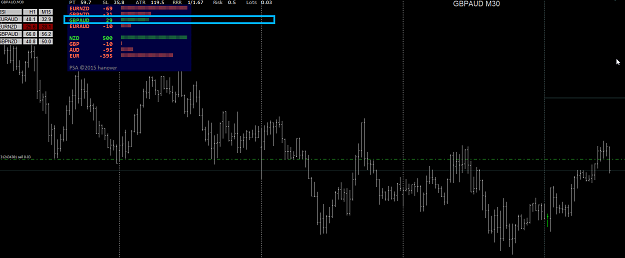
Cfd brokers use different symbol labelling but I have not seen any symbol with more than.10 digits. Can this dashboard be changed to have marketwatch symbols, preferbly with your two days open close lines proximity to current daily end levels in %, ADR range, pips from daily.ope or yesterday open level, bid ratio , hi lo range, and RSI values.
I have just found a dasboard where stop hunt is mentioned. Your Two days indicator works like a stop hunt identifier. The format of this indicator is excellent. https://www.forexfactory.com/thread/...2#post13547152
Good Day Blue Rain,
Would it be possible to add option for sound and notification alerts on your BR RSI Multi Signal scanner when the boxed symbol turns Green/Red?
It is a very useful indicator. Your efforts and contribution are much appreciated.
{quote} Please find V1.55 which I have added "MODE" as option. Default MODE is NUMBERS but you can change to DOTS in options. {image} once you set mode to DOTS, it will display trend as dots. Where Green dot is uptrend ( means RSI is rising ), and Red dot is downtrend ( means RSI is falling) Each C2,C1,C0 will compare value with previous bar and it will display dots accordingly. Numeric value is only shown when RSI value is crossing oversold/overbought line which you can set in option. example: S68 means RSI value is falling and crossed from above...
{quote} Updated.. if all C0/latest bar RSI values for all time frame are overbought or oversold, it will display boxed symbol name with green - oversold, red - overbought. But, it will be very rare to have all RSI value to be in overbought or oversold area if set to have 30/70. example pic is for oversold / overbought as 45/55 for demo purpose {image} {file}
Ignored
Great work. please can you remove the option of C or candle bar. so it just shows value of RSI PLZ. I WILL really be grateful. thank you.
{quote} {quote} Update option in the inputs allowing for the chart pair only to be used. {file} {quote} This should give you enough options to set it up however you require, use it as a multi TF display or set the "Number of Bars per Timeframe" to a large number and just use a single timeframe and set the desired timeframe in the inputs. The indicator is also Multi Pair and the Pairs can be reversed which puts them all in the same orientation. Reversed Pairs are colored Gold. See below screenshot. NOTE : The number of timeframes displayed and this...
Ignored
Plz CJA i will appreciate if we have this indicator in a different version, that only show value of rsi and multi pair. all others i found in other threads does not work well in template, if save and re-delete on mt4. the reason is because, if you put the others i found in other threads on platform, if you save it on template and re-apply it, if you delete it, it will not remove, even after delete, it will still be on the platform. I will really appreciate your help.