Thread Rules:
#1 ForexFactory Code of Conduct rules apply!
https://www.forexfactory.com/userguide
#2 User comments and questions are welcome, as long as they are on topic and are substantive!
#3 Personal, religious, political, racist, gender or sex oriented comments NOT allowed!
This includes posts of the "Keep up the good job!" type.
#4 Posting images of charts not related to the topic NOT allowed!
#5 Only images of charts with the indicators provided in this thread by me, the OP, are allowed!
#6 Positive contributions are welcome!
IOW: I do not care what you think about my methods and tools!
If you like what you are reading and seeing, you are WELCOME to join the journey.
If you do not like what you are reading and seeing, just leave and refrain from commenting.
Why I have decided to start this thread?
Cooperation leads to great results, however, I have noticed that on this forum there are a lot of conflicts and grudges, often long lasting ones, which make life more difficult than it needs to be, and make threads littered with useless and unsubstantive posts. This is why instead of starting another thread in Trading Systems, I have decided to start one in Trading Journals.
The ideas presented here might not be new, nor even very revelatory, nor are they the Holy Grail of trading. I am creating a study in order to see how oscillators could support the trader in making better decisions, and perhaps provide a better edge.
The tools:
Most of the tools you will see on my charts are my own tools, created by me. Other tools can be found on ForexFactory, or in other places in the internets.
The tools that can be found in ForexFactory are:
NewsCal 1.08a https://www.forexfactory.com/thread/...ndar-indicator
Stratman_MiniChart_v20 https://www.forexfactory.com/thread/198729-stratman-mini-chart-indicator
For the oscillators part you will need to visit the following threads:
Trading PlanetX & Oscillators https://www.forexfactory.com/thread/1145033-trading-planetx-oscillators
PlanetX Indicator - can this indi be used for trading? https://www.forexfactory.com/thread/...s-indi-be-used
I am using the data from the PlanetX indicators to create my own version of the oscillator.
My tools are:
Update on 2022.03.23:
Early AO signals now on chart!
Corrected some inconsistencies.
Works with:
New improved histogram visuals on different zooms.
These tools will be perfected in the future time. I am planning to create an all-in-one indicator, as I do have permission from the author of PlanetX to do so.
Another indicator which I am using at the moment is also available in ForexFactory:
super macd v1.0_ https://www.forexfactory.com/thread/...3#post10923293
The setup:
In order for PlanetAwesome indicators to work, you need to install first the PlanetX indicators.
PlanetAwesome-Oscilator-v5.2.ex4 preset file:
PlanetAwesome-OnChart-Signals.ex4 preset file:
I prefer to use only the signals on the charts, so if in the "Colors" tab 0 & 1 are colored, please set those to your chart background color, or to None if your bacground color is black.
The singals on the chart may sometimes not be exactly where the signals on the oscillator are.
At the moment, this is due to the way the PlanetX indicators are built, and this may change in the future.
After placing the PlanetAwesome-Oscilator-v5.2.ex4 on the chart, in order to get the two moving averages, we need to overlay the super macd v1.0_.mq4. Overlay, means we drop the indicator in the window where the PlanetAwesome-Oscilator-v5.2 is, not on the main chart. Here is the preset file:
Again, look into the "Colors" tab and check if colors 0 to 3 are set to your chart background color, or None if it's black. We do not need the MACD histogram overlayed.
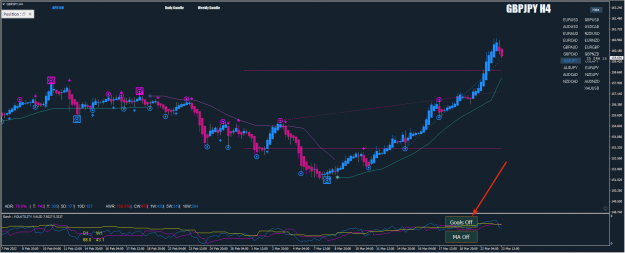
The prefered timeframe for this method is H1, though I will be using it mostly on M15.
The picture we are aiming to get is this:
(see attached image)
The strategy:
Any trading system or trading method is just like any business. The business stays alive only when it makes enough money to cover all the future losses and expenses, plus makes profit for the business owner(s). Translating these business rules to trading the charts, this means that the only way to stay alive in this trading business is to make enough money to cover the future Stop Losses, plus Profit.
Notice the emphasis on FUTURE!
Any business will only make money when they take advantage of opportunity, by which I mean that they buy cheap and sell expensive. Obviously, the cheaper they can buy their stock, the bigger margin they can sell at, provided there is demand for their stock.
This rule applies to trading price movements on charts even more strongly, because we never really know how far the move will go, unless we have insider info.
In order to stay alive in this business of trading, we need to obey the following rules:
1. Know the price of the most likely Take Profit Level!!!
This is THE MOST IMPORTANT element. If we don't know, or can not estimate this price, we should not be willing to take the risks involved with trading, because we are then just gambling our money!
2. Know the price of our necessary Stop Loss Level!!!
This is the second most important element. And we should never place our Stop Loss any further than that, no matter what!!!
3. Only when we know our Take Profit Price and our Stop Loss Price, can we know our optimal Entry Price!!!
Our Entry Price should be the price which will give us the optimal Risk/Reward Ratio!
4. We should only take the opportunity, which means Enter a Trade, if we can get our Entry Price!!!
If the market does not offer us our Entry Price, we should abandon this trade and wait for a new opportunity!
5. Under no condition, should we ever gamble our money by making bad deals!!!
Now, all we need to do, is repeat the process every time one of these happens:
1. After we get our Take Profit,
2. After we get our Stop Loss.
We need to set all emotions aside, all urges should stay outside our trading office/desk, we just need to repeat the whole process from the begining to end!
This is, in fact, simple, yet difficult, but isn't that true for any business?
In order to implement this strategy, I am going to use the above tools to look for opportunities, but MOST IMPORTANTLY, the basic tool will be THE CHART, itself, because all the information shown by indicators and oscillators comes from the chart, not the other way, so the chart needs to be the last decisive factor.
I am going to use my Expert Advisor as a helper tool to calculate the trade volume (Lot) in order that my Stop Loss Price will represent maximum 2% Risk, calculated from the account balance, or equity, whichever is smaller.
I am going to look for my Entry Price at the level which will give me 3.236% Take Profit, so the RR will be 1 Risk to 1.618 Reward.
This means, that every time I get my Take Profit, I will have earned the 2% for my future Stop Loss, and 1.236% extra.
Mathematically, this should work even if the trader has 50% win/loss ratio.
Why do 99% (number taken out of my ass) of traders lose money?
Because they break the rules and gamble their money. It only takes one gambling trade to lose most if not all of your account!!!
In order to plot out our trade/position Prices, we just need 3 horizontal lines:
1. Take Profit Line,
2. Stop Loss Line,
3. Entry Line.
We can use the Fibonacci tool and customize it to only 3 lines, or we can just use 3 horizontal lines, or we can use another custom tool to make life easier, and an Expert Advisor that will read the lines and do all the calculations for us.
I think this is all of the basics, for now, and the rest will become more clear as I go along posting trades.
I do not claim to be perfect, nor do I claim that this will work.
This is a study, not investment advice!
Update as of 2022.03.22!
Due to some advancements, I am adding a new tool:
Update on 2022.03.26
What's new?
Now, there are 5 individual buttons for plotting MA extensions, and one for plotting the line chart. Please first switch the MA Off button to MA On in order for the other buttons to work!
Added Focal points, crosses of SMA16 & SMA32!
The MA's have been plotted in reverse order from the previous version!
Of course, you may want to use it or not. It is just another potential edge.
The tool plots 5 moving averages plus a line graph of Close prices.
It also plots extensions of the chosen moving averages.
All plotting is done from 2 buttons on the chart.
UPDATE 2022.04.13
After 3 weeks observing the behaviours of the oscillators I have reached the conclusion that their behaviours are inconsistent, which means that sometimes they show good signals, but then they show bad signals, and this fact makes them useless for trading, and even makes them a significant nuisance, a major unecessary complication to trading!
An indicator which provides better information about the state of the given market is the VWAP indicator:
which I have currently applied to my charts.
One Important Message!
If you need help to code an EA for automatic trading this, or any idea, go to this thread:
https://www.forexfactory.com/thread/...indicators-for
Otherwise, please do not bother me with solving your problems, if you don't have much idea about what you are doing.
#1 ForexFactory Code of Conduct rules apply!
https://www.forexfactory.com/userguide
#2 User comments and questions are welcome, as long as they are on topic and are substantive!
#3 Personal, religious, political, racist, gender or sex oriented comments NOT allowed!
This includes posts of the "Keep up the good job!" type.
#4 Posting images of charts not related to the topic NOT allowed!
#5 Only images of charts with the indicators provided in this thread by me, the OP, are allowed!
#6 Positive contributions are welcome!
IOW: I do not care what you think about my methods and tools!
If you like what you are reading and seeing, you are WELCOME to join the journey.
If you do not like what you are reading and seeing, just leave and refrain from commenting.
Why I have decided to start this thread?
Cooperation leads to great results, however, I have noticed that on this forum there are a lot of conflicts and grudges, often long lasting ones, which make life more difficult than it needs to be, and make threads littered with useless and unsubstantive posts. This is why instead of starting another thread in Trading Systems, I have decided to start one in Trading Journals.
The ideas presented here might not be new, nor even very revelatory, nor are they the Holy Grail of trading. I am creating a study in order to see how oscillators could support the trader in making better decisions, and perhaps provide a better edge.
The tools:
Most of the tools you will see on my charts are my own tools, created by me. Other tools can be found on ForexFactory, or in other places in the internets.
The tools that can be found in ForexFactory are:
NewsCal 1.08a https://www.forexfactory.com/thread/...ndar-indicator
Stratman_MiniChart_v20 https://www.forexfactory.com/thread/198729-stratman-mini-chart-indicator
For the oscillators part you will need to visit the following threads:
Trading PlanetX & Oscillators https://www.forexfactory.com/thread/1145033-trading-planetx-oscillators
PlanetX Indicator - can this indi be used for trading? https://www.forexfactory.com/thread/...s-indi-be-used
I am using the data from the PlanetX indicators to create my own version of the oscillator.
My tools are:
Update on 2022.03.23:
Attached File(s)
Early AO signals now on chart!
Corrected some inconsistencies.
Works with:
Attached File(s)
These tools will be perfected in the future time. I am planning to create an all-in-one indicator, as I do have permission from the author of PlanetX to do so.
Another indicator which I am using at the moment is also available in ForexFactory:
super macd v1.0_ https://www.forexfactory.com/thread/...3#post10923293
The setup:
In order for PlanetAwesome indicators to work, you need to install first the PlanetX indicators.
PlanetAwesome-Oscilator-v5.2.ex4 preset file:
Attached File(s)
PlanetAwesome-OnChart-Signals.ex4 preset file:
Attached File(s)
The singals on the chart may sometimes not be exactly where the signals on the oscillator are.
At the moment, this is due to the way the PlanetX indicators are built, and this may change in the future.
After placing the PlanetAwesome-Oscilator-v5.2.ex4 on the chart, in order to get the two moving averages, we need to overlay the super macd v1.0_.mq4. Overlay, means we drop the indicator in the window where the PlanetAwesome-Oscilator-v5.2 is, not on the main chart. Here is the preset file:
Attached File(s)
The prefered timeframe for this method is H1, though I will be using it mostly on M15.
The picture we are aiming to get is this:
(see attached image)
The strategy:
Any trading system or trading method is just like any business. The business stays alive only when it makes enough money to cover all the future losses and expenses, plus makes profit for the business owner(s). Translating these business rules to trading the charts, this means that the only way to stay alive in this trading business is to make enough money to cover the future Stop Losses, plus Profit.
Notice the emphasis on FUTURE!
Any business will only make money when they take advantage of opportunity, by which I mean that they buy cheap and sell expensive. Obviously, the cheaper they can buy their stock, the bigger margin they can sell at, provided there is demand for their stock.
This rule applies to trading price movements on charts even more strongly, because we never really know how far the move will go, unless we have insider info.
In order to stay alive in this business of trading, we need to obey the following rules:
1. Know the price of the most likely Take Profit Level!!!
This is THE MOST IMPORTANT element. If we don't know, or can not estimate this price, we should not be willing to take the risks involved with trading, because we are then just gambling our money!
2. Know the price of our necessary Stop Loss Level!!!
This is the second most important element. And we should never place our Stop Loss any further than that, no matter what!!!
3. Only when we know our Take Profit Price and our Stop Loss Price, can we know our optimal Entry Price!!!
Our Entry Price should be the price which will give us the optimal Risk/Reward Ratio!
4. We should only take the opportunity, which means Enter a Trade, if we can get our Entry Price!!!
If the market does not offer us our Entry Price, we should abandon this trade and wait for a new opportunity!
5. Under no condition, should we ever gamble our money by making bad deals!!!
Now, all we need to do, is repeat the process every time one of these happens:
1. After we get our Take Profit,
2. After we get our Stop Loss.
We need to set all emotions aside, all urges should stay outside our trading office/desk, we just need to repeat the whole process from the begining to end!
This is, in fact, simple, yet difficult, but isn't that true for any business?
In order to implement this strategy, I am going to use the above tools to look for opportunities, but MOST IMPORTANTLY, the basic tool will be THE CHART, itself, because all the information shown by indicators and oscillators comes from the chart, not the other way, so the chart needs to be the last decisive factor.
I am going to use my Expert Advisor as a helper tool to calculate the trade volume (Lot) in order that my Stop Loss Price will represent maximum 2% Risk, calculated from the account balance, or equity, whichever is smaller.
I am going to look for my Entry Price at the level which will give me 3.236% Take Profit, so the RR will be 1 Risk to 1.618 Reward.
This means, that every time I get my Take Profit, I will have earned the 2% for my future Stop Loss, and 1.236% extra.
Mathematically, this should work even if the trader has 50% win/loss ratio.
Why do 99% (number taken out of my ass) of traders lose money?
Because they break the rules and gamble their money. It only takes one gambling trade to lose most if not all of your account!!!
In order to plot out our trade/position Prices, we just need 3 horizontal lines:
1. Take Profit Line,
2. Stop Loss Line,
3. Entry Line.
We can use the Fibonacci tool and customize it to only 3 lines, or we can just use 3 horizontal lines, or we can use another custom tool to make life easier, and an Expert Advisor that will read the lines and do all the calculations for us.
I think this is all of the basics, for now, and the rest will become more clear as I go along posting trades.
I do not claim to be perfect, nor do I claim that this will work.
This is a study, not investment advice!
Update as of 2022.03.22!
Due to some advancements, I am adding a new tool:
Update on 2022.03.26
Attached File(s)
What's new?
Now, there are 5 individual buttons for plotting MA extensions, and one for plotting the line chart. Please first switch the MA Off button to MA On in order for the other buttons to work!
Added Focal points, crosses of SMA16 & SMA32!
The MA's have been plotted in reverse order from the previous version!
Of course, you may want to use it or not. It is just another potential edge.
The tool plots 5 moving averages plus a line graph of Close prices.
It also plots extensions of the chosen moving averages.
All plotting is done from 2 buttons on the chart.
UPDATE 2022.04.13
After 3 weeks observing the behaviours of the oscillators I have reached the conclusion that their behaviours are inconsistent, which means that sometimes they show good signals, but then they show bad signals, and this fact makes them useless for trading, and even makes them a significant nuisance, a major unecessary complication to trading!
An indicator which provides better information about the state of the given market is the VWAP indicator:
Attached File(s)
One Important Message!
If you need help to code an EA for automatic trading this, or any idea, go to this thread:
https://www.forexfactory.com/thread/...indicators-for
Otherwise, please do not bother me with solving your problems, if you don't have much idea about what you are doing.
Attached Image (click to enlarge)
![Click to Enlarge
Name: [DAX40]M15.jpg
Size: 426 KB](/attachment/image/4167267/thumbnail?d=1647641213)
.ex4/.ex5 files can't be fixed or modified / I'm not a coder!
![Click to Enlarge
Name: [DAX40]M15.jpg
Size: 522 KB](/attachment/image/4170274/thumbnail?d=1648037218)
![Click to Enlarge
Name: [DAX40]M15.jpg
Size: 498 KB](/attachment/image/4170284/thumbnail?d=1648037845)
![Click to Enlarge
Name: [DAX40]M15.jpg
Size: 525 KB](/attachment/image/4170289/thumbnail?d=1648038240)
![Click to Enlarge
Name: [DAX40]M15.jpg
Size: 492 KB](/attachment/image/4170292/thumbnail?d=1648038446)
![Click to Enlarge
Name: [DAX40]M15.jpg
Size: 522 KB](/attachment/image/4170297/thumbnail?d=1648038720)
![Click to Enlarge
Name: [DAX40]M15.jpg
Size: 580 KB](/attachment/image/4170301/thumbnail?d=1648038882)
![Click to Enlarge
Name: [DAX40]M15.jpg
Size: 577 KB](/attachment/image/4170303/thumbnail?d=1648039015)
![Click to Enlarge
Name: [DAX40]M15.jpg
Size: 543 KB](/attachment/image/4170354/thumbnail?d=1648042988)
![Click to Enlarge
Name: [DAX40]M15.jpg
Size: 542 KB](/attachment/image/4170394/thumbnail?d=1648045111)
![Click to Enlarge
Name: [DAX40]M15.jpg
Size: 553 KB](/attachment/image/4170486/thumbnail?d=1648050996)